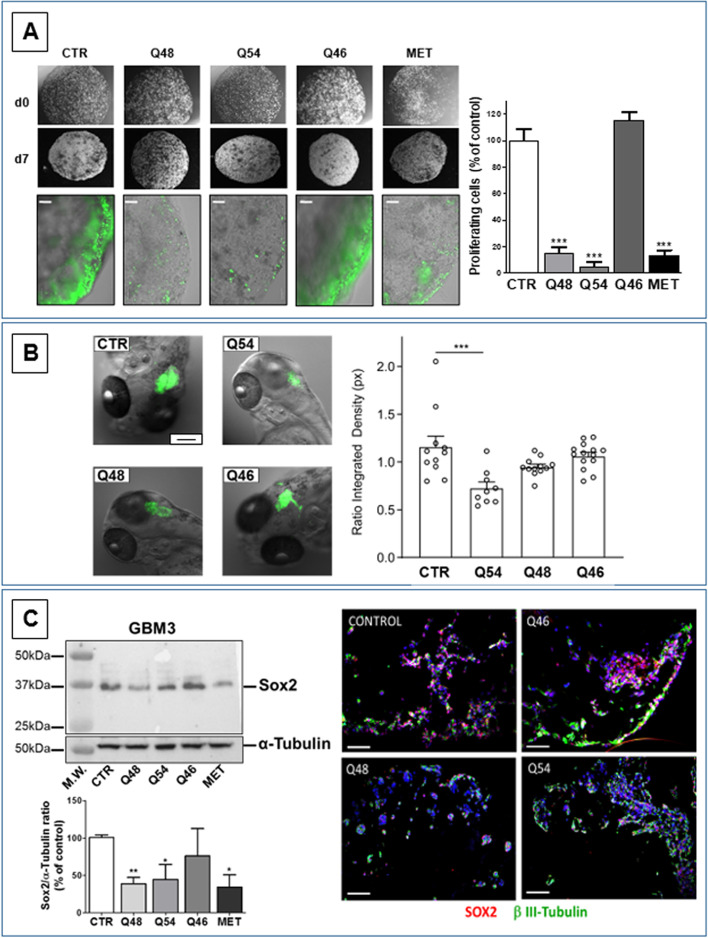
Fig. 5.
A Q48 and Q54 and metformin, display antiproliferative activity in the GSC organoids. Representative images of organoids at d0 and d7, prior to treatment (upper pictures). After further 7 days of treatment proliferating cells were labelled with 5-EdU (green in the lower pictures). Bar = 100 μm. The quantification of the compound-dependent changes in proliferation rate (reported as % of control values in the graph) was obtained using the ImageJ software. Q48 and Q54 (100 μM) and metformin (10 mM) caused a highly significant reduction of proliferating cells, while Q46 was not effective. ***p < 0.001 vs. CTR. B In vivo antitumor activity of novel biguanides in zebrafish xenotransplanted with GCSs. Left: Representative pictures showing the expansion of the tumor mass at 72 h post injection in zebrafish embryos’ brain injected with ZsGreen-positive cells treated with 1 mM Q54, Q48, and Q46 dissolved in embryos’ water. CTR = controls. Scale bar 100 μm. Right: Quantification of the integrated density of the tumor mass in control condition or in presence of the compounds. Every experimental point represents the expansion of the tumor mass measured in the single embryo’s brain. Data are reported as mean ± SEM; CTR n = 11, Q54 n = 9, Q48 n = 12, Q46 = 14; ***p = 0 .0002. C Biguanide treatment selectively reduce Sox2+ cell content. Left: Western blot depicting Sox2 levels in GBM3 GSCs cultures in control conditions (CTR) or after treatment with with Q48 (100 μM), Q54 and Q46 (300 μM), and metformin (10 mM) for 48 h α-tubulin analysis was used to normalize the results for protein content (upper panel). All the treatments, but Q46, significantly reduced Sox2 expression. Quantification by densitometric analysis normalized for α-tubulin expression, reported as the average of two independent analyses (lower panel). * = p < 0.05; ** = p < 0.01. Right: Representative images of the changes in cell composition within organoids after Q46, Q48, and Q54 treatment evaluated by immunofluorescence, labelling GSCs (Sox2-expressing, red) and differentiated cells (β-III tubulin-expressing, green). Nuclei are counterstained with DAPI (blue). Bar = 200 μm. Q48 and Q54 treatment significantly reduced the number of Sox2-expressing cells (purple for the co-localization of Sox2, red, and nuclei, blue) as compared to vehicle-treated control. Q46 is ineffective

