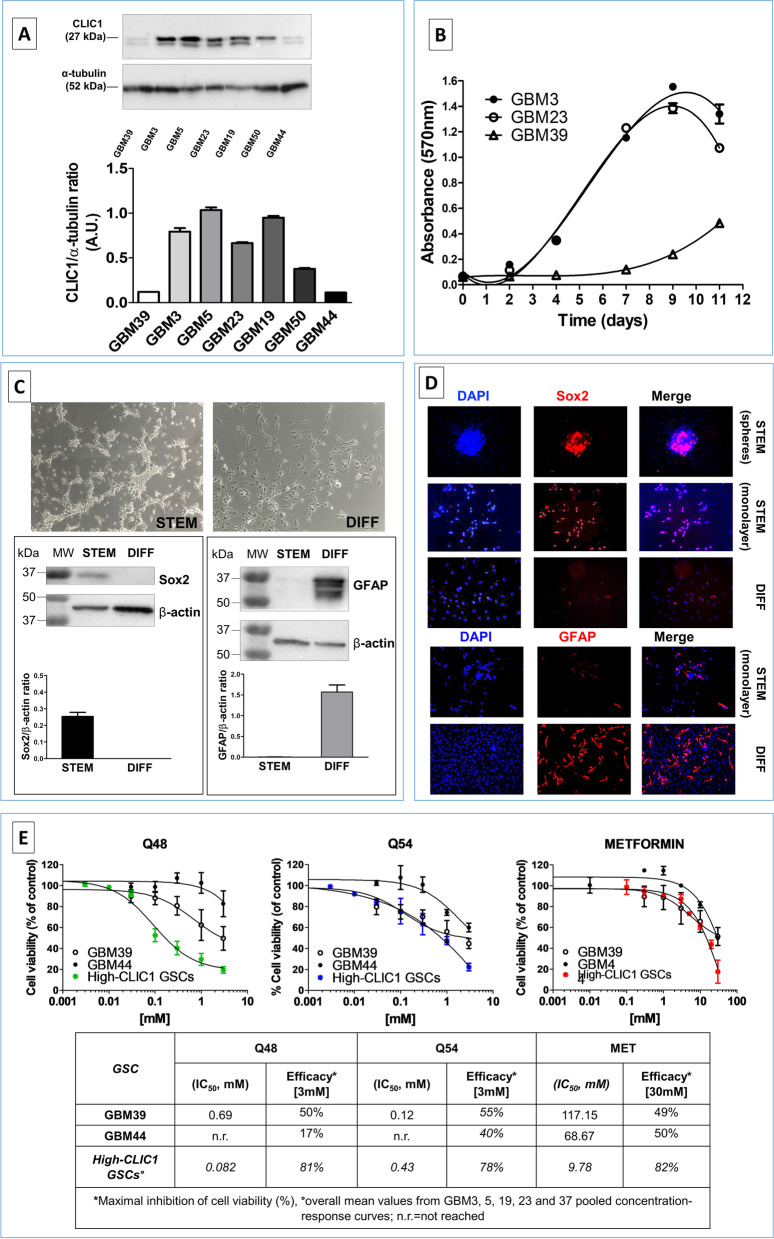
Fig. 6.
Characterization of GSC cultures expressing low levels of CLIC1 protein. A Selected GSC cultures expressing high and low levels of CLIC1 mRNA (see Fig. S2) were analyzed by Western blotting altogether with novel cultures to select GSC with low CLIC1 protein content. Western blot analysis of total cell lysates from seven GSC cultures. Membranes were re-probed with α-tubulin antibody after stripping and used as a reference for protein loading (upper panel). Densitometric analysis of CLIC1 levels in the same samples. Data are expressed as mean ± S.D. of CLIC1 densitometric values normalized using respective α-tubulin densitometry (lower panel). GSCs from GBM39 and GBM 44 display low CLIC1 expression as compared to GBM3, 5, 18, and 23. CLIC1 expression in GBM50 was intermediate between these two groups. B Growth curves of low- (GBM39) and high- (GBM3, GBM23) CLIC1-expressing GSCs. Cell viability and proliferation measurement was performed by MTT assay (n = 3). The growth curves were modeled by non-linear third order polynomial fitting. A significant lower proliferation rate was observed in GSCs isolated from GBM39. C Low expressing CLIC1 GSCs retain differentiating ability. Upper pictures: morphological appearance of GBM44 cells grown in stem cell-permissive serum-free medium (STEM, phase contrast microscopic image, bar =10 μm) or after shifting for 2 weeks in 10% FBS-containing medium (DIFF, bar =10 μm). Lower panels: representative western blots of the immunoreactivity for the stem cell marker, Sox2 (left) and for the astrocytic differentiation marker GFAP (right) in GBM44 GSCs and differentiated cell lysates. Membranes were re-probed with β-actin antibody after stripping and used as a reference for protein loading. Histograms report the densitometric analysis of Sox2 and GFAP levels, expressed as mean ± S.D. of densitometric values normalized with β-actin content. GBM44 differentiation is characterized by loss of Sox2 and increased GFAP expression, as occurs in high CLIC1-expressing GBMs. D Upper panels: Immunofluorescence analysis of Sox2 expression in GSC spheroids (upper pictures, bar = 200 μm), GSC monolayers (middle pictures, bar = 100 μm) and differentiated GBM cells (lower pictures, bar = 100 μm) in GBM44 culture. Sox2-positive cells are red and nuclei counterstained with DAPI (blue). Lower panel: GFAP-positive cells (red) in GBM44 GSCs grown as monolayer and their differentiated counterpart. Nuclei were counterstained with DAPI (blue). Bar = 200 μm. E Antiproliferative activity of Q48, Q54 and metformin in low CLIC1-expressing CLIC1 GSCs. Upper panels: concentration-response curves, obtained from MTT assay after 48 h treatment, in low-expressing GBM37 and GBM44 cultures compared with the average response obtained in high-expressing GBM GSCs. Data represent the pooled mean ± SEM from N = 3 independent experiments. Lower Table: mean IC50 value (potency) and maximal inhibition (efficacy) reached for each compound obtained from the concentration-response curves. See the text for description

