Fig. 7.
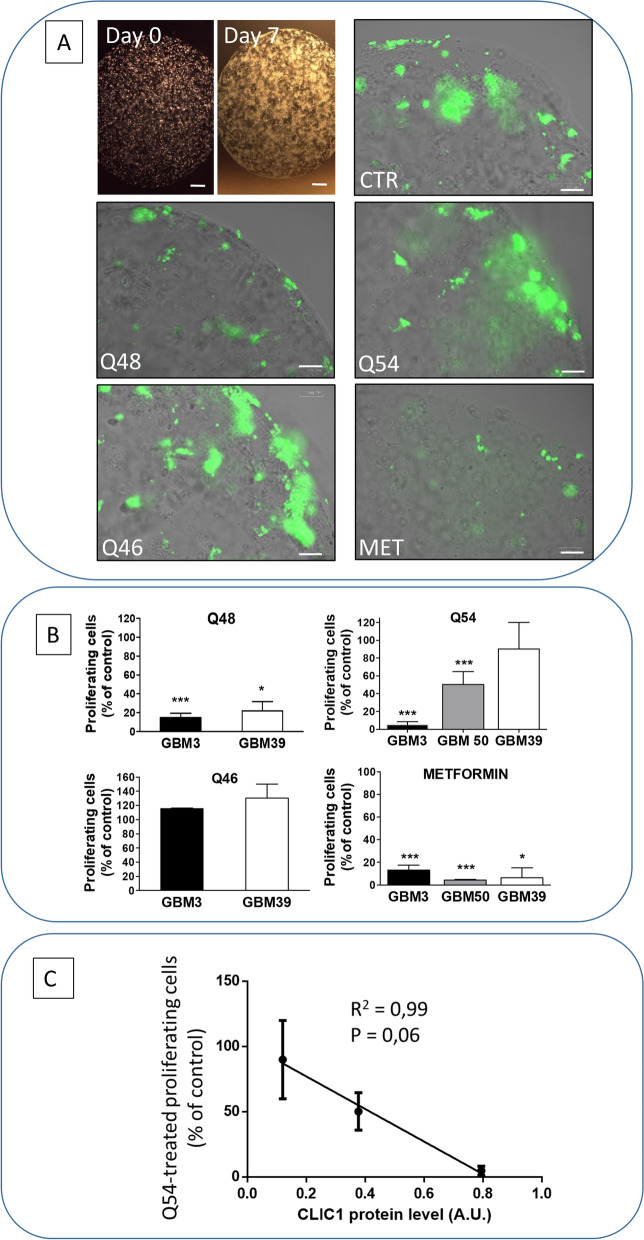
A Low CLIC1-expressing GSCs, derived from GBM39, are able to grow as 3D organoids. Up-left pictures: representative images soon after plating (day 0) and after 1 week (day 7); bar = 300 μm. Up-right and following pictures: representative images of GBM39 organoids labeled with 5-EdU (green) to evidence cells in active proliferation. Vehicle-treated cells (CTR) display a lower proliferative rate than high CLIC1-expressing organoids (see Fig. 4A). However, 7-day treatment with Q48 and metformin further reduced proliferating cells. Beside Q46 which was ineffective, as already shown on other parameters, also Q54 was unable to reduce organoid cell proliferation in GBM39. bar = 100 μm. B Quantification of Q48, Q54, Q46 (100 μM), and metformin (10 mM) -dependent changes in organoid proliferation rate. Data, obtained using ImageJ software, are reported as % of control values in the graph. Antiproliferative activity is reported comparing the responses in high CLIC1-expressing GSCs (GBM3) and low CLIC1-expressing GSCs (GBM39). Q54 and metformin were also tested on GBM50 which expresses CLIC1 at an intermediate level (see Fig. 5A). While Q48 and metformin reduced proliferation in organoids independently from CLIC1 expression levels, Q54 efficacy was directly proportional to the expression of the channel. *p < 0.05, ***p < 0.001 vs. respective control samples. C Linear regression (R2 = 0.99) correlating CLIC1 expression and Q54 antiproliferative activity in GSC-derived organoids

