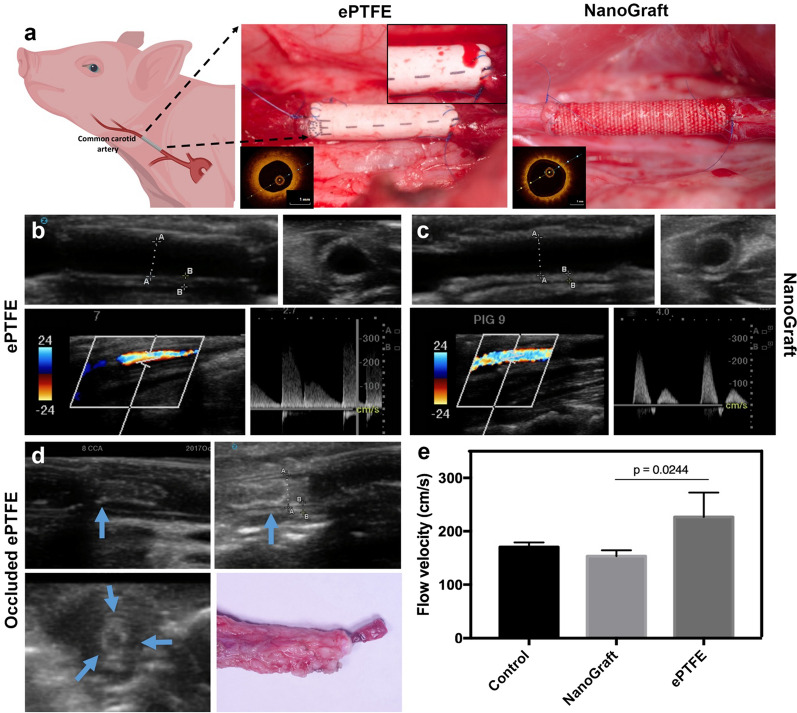
Fig. 2.
In-vivo implantation and imaging assessment of ePTFE and NanoGraft grafts: a direct representative picture of the ePTFE graft with oozing from suture line and NanoGraft with no oozing. Inset shows the OCT image of the patent grafts. Representative 2D Doppler of the longitudinal and cross-sectional view of b ePTFE and c NanoGrafts (distance A- 3.8 mm, B-0.7 mm), with the corresponding qualitative and quantitative evaluation of blood flow through the grafts (bottom in b and c). d 2D Doppler of the longitudinal and cross-sectional view of the occluded ePTFE grafts (blue arrows depict the regions with adherent clots) and its corresponding optical image. e Quantitative evaluation of blood flow through the patent synthetic grafts before and after implantation

