Fig. 2.
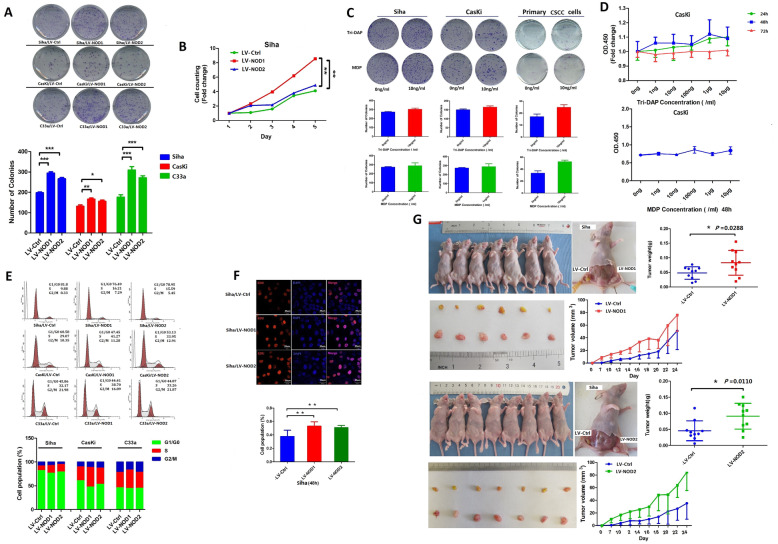
NOD1 and NOD2 enhanced the proliferation of CSCC cells. A Number of colonies formed by Siha, CasKi, and C33a cells overexpressing NOD1 or NOD2 (each group was performed triplicate wells, reproducible in three independent experiments). B Time-dependent increase in the number of Siha/LV-NOD1 and Siha/LV-NOD2 cells (results were highly reproducible triplicate: representative data of triplicate). C Number of colonies formed by cell lines and primary CSCC cells treated with Trip-DAP or MDP (10 ng/mL). D Proliferation of cell lines treated with various concentrations of NOD1 or NOD2 ligands. The assay of C and D was repeated thrice for the cell lines and twice for the primary cells using three independent samples. E Cell cycle distribution of control and NOD1/NOD2 overexpressing Siha, CasKi, and C33a cells. The percentage of cells in each phase is shown on the right. F Representative images of EDU-stained Siha/LV-NOD1, Siha/LV-NOD2, and Siha/LV-Ctrl cells (scale bar—30 μm, triplicate independent experiments). G Representative images of tumors in BALB/C nude mice subcutaneously injected with Siha/LV-NOD1, Siha/LV-NOD2 (right), and respective control cells (left). The tumor volume and weight of the indicated groups are shown on the right. All data are presented as mean ± SD (n = 10 for each group). *** P < 0.001; ** P < 0.01; * P < 0.05

