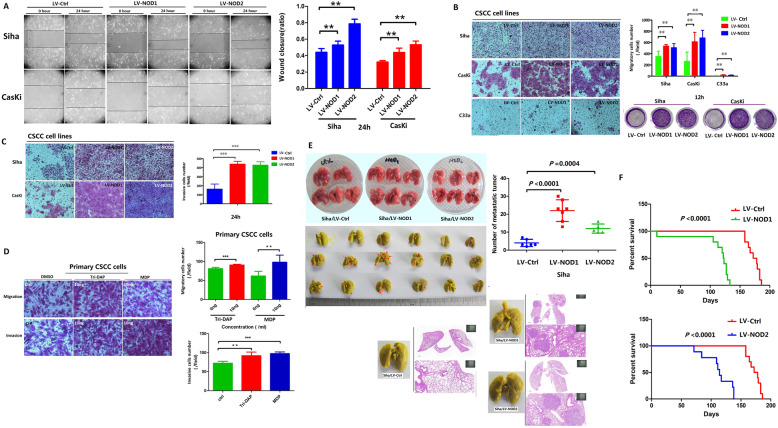
Fig. 3.
NOD1 and NOD2 promoted migration and invasion of CSCC cells. A Representative images showing wound closure of control and NOD1/2-overexpressing Siha and CasKi cells at 24 h after scratching. The percentage of wound healing is shown on the right. Data represent triplicates of one representative experiment. B, C The representative images indicating migration (panel B) (Siha, CasKi and C33a) and invasion (panel C) (Siha and CasKi) ability of NOD1/NOD2-overexpressing cell lines by transwell assay (reproducible in three independent experiments in triplicate wells). D Representative migration and invasion images of the primary CSCC cells by transwell members (The cells were pretreated with 10 ng/mL Tri-DAP or MDP at 24 h) (three independent experiments with three primary CSCC cells, triplicate wells; magnification × 100). E Number of lung metastatic nodules (The yellow arrows indicate representatively metastatic nodes in fresh lung; the red arrows indicate the nodes in fixed lung) in mice injected with Siha/LV-Ctrl, Siha/LV-NOD1, and Siha/LV-NOD2 cells (mouse harboring Siha/LV-Ctrl: n = 6, mouse harboring Siha/LV-NOD1: n = 6, mouse harboring Siha/LV-NOD2: n = 6). F Kaplan-Meier curves showing OS of the above tumor-bearing groups (n = 10 for each group). All data are presented as mean ± SD. *P < 0.05; ** P < 0.01; *** P < 0.001

