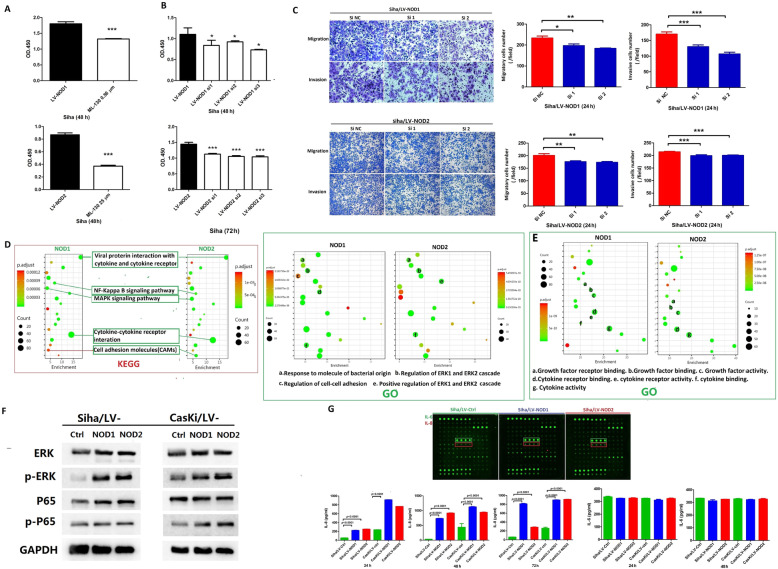
Fig. 4.
NOD1/NOD2 promote CSCC tumorigenesis by activating the ERK and NF-κB signaling pathways. A Proliferation rates of Siha/LV-NOD1 and Siha/LV-NOD2 treated with 0.56 μM (upper) and 25 μM (lower) ML-130. B Proliferation of Siha/LV-NOD1 and Siha/LV-NOD2 cells transfected with the NOD1 and NOD2 siRNAs. C Representative images of transwell assay showing the migration and invasion of Siha/LV-NOD1 and Siha/LV-NOD2 cells with NOD1 or NOD2 knockdown. D Protein arrays showing the molecules and signaling pathways involved in the upregulation of NOD1 and NOD2 (data was merged with Siha and CasKi cells)—viral protein interactions (left), bacterial response (right), MAPK, and NF-κB signaling pathways (left) and ERK cascade (right). E GO analysis showing enriched proteins in Siha and CasKi cells transfected with LV-NOD1 or LV-NOD2 compared to LV-Ctrl. F Immunoblots showing expression of ERK/p-ERK and NF-κB/p-NF-κB in LV-NOD1 or LV-NOD2 CSCC cell lines (Siha and CasKi). G Representative cytokine array panels for Siha/LV-NOD1 and Siha/LV-NOD2 cells (upper panel) and cytokine levels validated by ELISA (lower panel). Data of CSCC cell lines represent triplicate independent experiment of representative one. The data of C and G were performed with triplicate wells. All data are presented as the mean ± SD. *P < 0.05; **P < 0.01; ***P < 0.001

