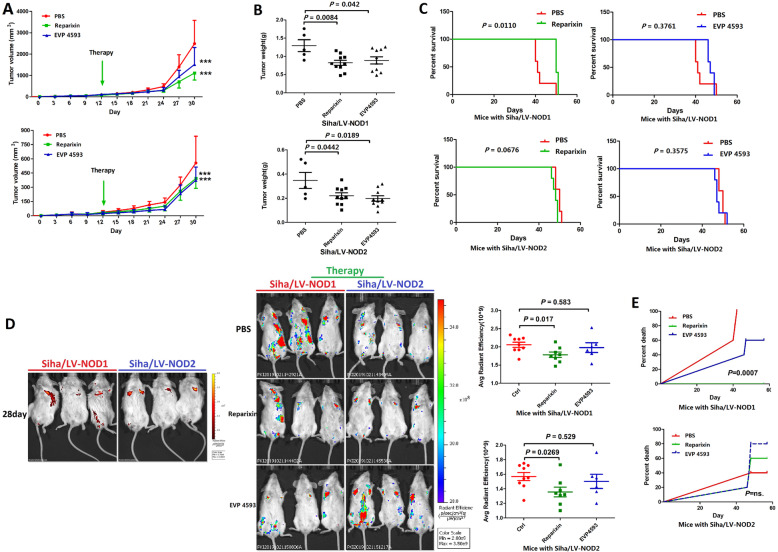
Fig. 6.
Reparixin inhibited growth of NOD1high and NOD2high CSCC tumors in vivo. A Volume of Siha/LV-NOD1 and Siha/LV-NOD2 tumors in the untreated (n = 5), Reparixin (n = 10), and EVP4593 (n = 10) groups. B Tumor weight in the Reparixin (n = 10), EVP4593 (n = 10), and PBS (n = 5) groups. C OS Kaplan-Meier curves of mice in the above groups. D Representative fluorescence images showing metastasis of GFP+ Siha/LV-NOD1 or Siha/LV-NOD2 cells in the indicated groups (mouse harboring GFP+ Siha/LV-NOD1: Group treated by PBS: n = 9; group treated by Reparixin: n = 8; group treated by EVP4593: n = 6. mouse harboring GFP+ Siha/LV-NOD2: Group treated by PBS: n = 9; group treated by Reparixin: n = 8; group treated by EVP4593: n = 6). Quantification of GFP intensity is shown on the right. E Survival curves of the above tumor-bearing mice treated with PBS, Reparixin, or EVP4593. The results are presented as mean ± SD. ***P < 0.001; **P < 0.01; * P < 0.05

