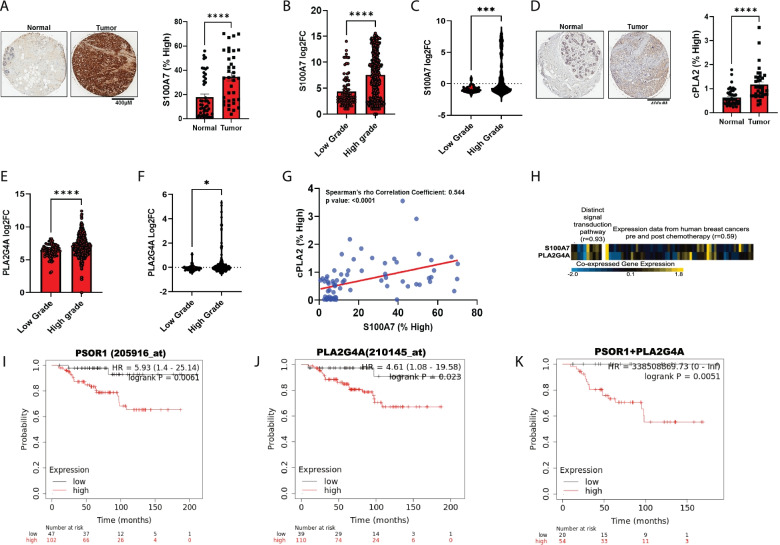
Fig. 1.
High co-expression of S100A7 and cPLA2 (PLA2G4A) is associated with poor clinical prognosis in breast cancer. Representative immunohistochemistry (IHC) images of (A). S100A7 and (D). cPLA2 proteins in malignant breast tumor samples (n = 36) and normal tissues (n = 46) [source: US Biomax]. Percent high-positive cells were quantified (right). Non-parametric test (Mann-Whitney U test) was applied. Relative mRNA expression (log2 fold change) of S100A7 and cPLA2 (PLA2G4A) were analyzed in low (n = 82) and high grades (n = 450) of breast tumor tissues using (B & E). GENT2 database (http://gent2.appex.kr/gent2/) and (C & F). also in low (n = 39) and high (n = 183) grades of breast cancer samples using Caldas & Chin datasets (n = 222). t test was used to calculate the p values (G). Correlation analysis between S100A7 and cPLA2 protein levels (% high positive) in a tumor tissue microarray (TMAs) of malignant breast cancer patients (n = 74) (H). Heatmap showing the correlation of S100A7 and cPLA2 in distinct signal transduction pathways (correlation coefficient = 0.93; NCBI GEO dataset: GSE39965) and expression in breast tumor tissues of pre-and post-chemotherapy (correlation coefficient = 0.59; NCBI GEO dataset: GSE18728). The pre and post chemotherapy analysis of baseline gene expression comprised baseline samples from 28 breast cancer patients which include17 non-responders and 11 responders. Analyses of gene expression changes involved paired baseline and post-cycle one specimens from 14 patients; of these 8 patients were non-responders and 6 patients were responders. (source: SEEK database). KM-plotter survival analysis (gene chip) of (I). S100A7 (PSOR1) alone, (J). cPLA2 (PLA2G4A) alone and (K). Combined S100A7 and cPLA2 (analysis include only patients with high median expression of genes) mRNAs expression with overall survival (OS) probability of immunomodulatory (IM) subtype of breast cancer patients. ns: non-significant, *P < 0.05, ** P < 0.01, *** P < 0.001, **** P < 0.0001. scale bar: 300 μm

