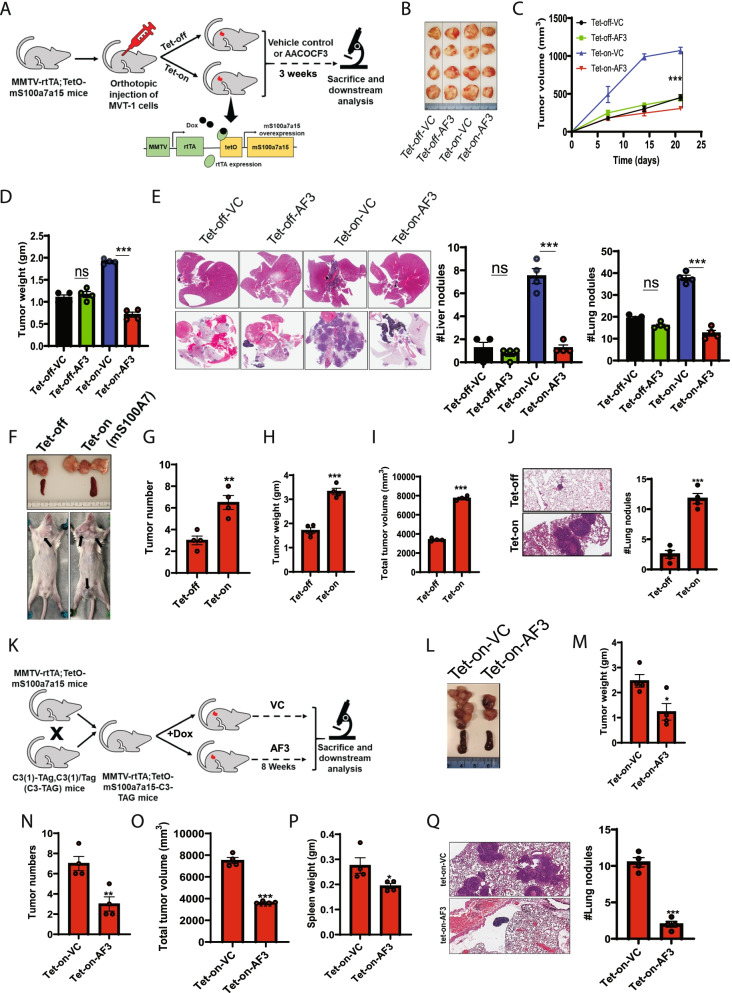
Fig. 3.
Inhibition of cPLA2 reduces S100A7-enhanced breast tumor growth and metastasis in MMTV-rtTA;TetO-mS100a7a15 bi-transgenic mice model (A). Schematic representation showing the generation and treatment of the doxycycline (DOX) inducible mS100a7a15 bi-transgenic (Tet-O, tet operator) MVT1 tumor-bearing mouse model. In brief, 1X10⁵ MVT1 cells into the 4th mammary gland (MG) of the bi-transgenic mice. Mice were fed with either 1 g/kg.bt. doxycycline diet (Tet-on; n = 8) or normal diet (Tet-off; n = 8). After the onset of palpable tumors, each group was divided into 2 subgroups (n = 4 each) and were treated with VC or AF3 (5 mg/kg.bt) intraperitoneal (i.p.) twice a week for 3 weeks. Tumor volume was measured once a week in these mice. After 21 days, the tumors were harvested from these mice and weighed (B). Representative photographs of tumors dissected from different experimental groups (C). Graph showing the tumor volume (mm3) and (D). tumor weight (gm) of each experimental group treated with VC and AF3 (E). Representative image of H&E staining of metastatic nodules in the liver (top) and lung (bottom) of VC and AF3 treated mice. Bar diagram represents the means ±SEMs of four replicates (F). Representative image showing the tumors harvested from Tet-off (normal diet) and Tet-on (DOX diet) groups with MMTV-rtTA;TetO-mS100a7a15-C3-TAG genotype. Graph showing the (G). the total number of tumors, (H). tumor weight (gm) (I). total tumor volume (mm3) and (J). the number of lung nodules in Tet-off and Tet-on groups (K). Schematic approach showing the treatment of spontaneous breast cancer model of mS100a7a15 overexpressing (MMTV-rtTA;TetO-mS100a7a15-C3-TAG) mice. MMTV-rtTA;TetO-mS100a7a15-C3-TAG female mice (6 weeks old) were fed with DOX diet (Tet-on) and after the onset of palpable tumors, mice were either treated with VC or AF3 (5 mg/kg.bt) intraperitoneal (i.p.) twice in a week for 8 weeks. Tumor volumes were measured externally by using Vernier caliper. At the endpoint, mice were sacrificed and tumors and other organs were harvested for downstream analysis (L). Photomicrographs of tumors harvested from Tet-on mice treated with VC or AF3. Graph showing the (M). tumor weight (gm), (N). the total number of tumors, (O). total tumor volume (mm3) and (P). Spleen weight (gm) and (Q). the number of lung nodules in Tet-off and Tet-on groups. The graphs indicate the means ±SEMs of four replicates. ns: non-significant, *P < 0.05, ** P < 0.01, *** P < 0.001. t test and one way ANOVA was used for calculating statistical significance

