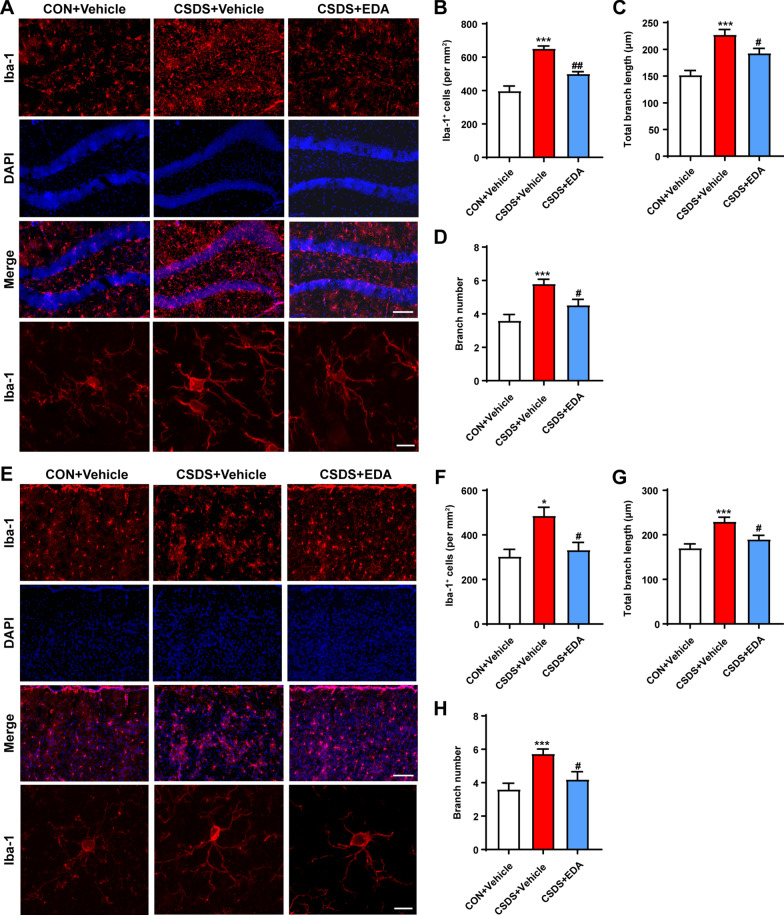
Fig. 3.
Effects of EDA on microglial activation in the CSDS mice Hip and mPFC. A EDA inhibited microglial activation in the CSDS mice Hip. Representative images of microglia immunostaining for Iba-1. Scale bars, 100 μm (upper panel) and 10 μm (lower panel). B Quantification of Iba-1 positive cells per mm2 in the mice Hip. C Total branch length. D Branch number. E EDA inhibited microglial activation in the CSDS mice mPFC. Representative images of microglia immunostaining for Iba-1. Scale bars, 100 μm (upper panel) and 10 μm (lower panel). F Quantification of Iba-1 positive cells per mm2 in the mPFC. G Total branch length. H Branch number. All the data are presented as mean ± SEM (n = 3 mice/group, 15 cells/group). *p < 0.05, ***p < 0.001 versus the CON + Vehicle group. #p < 0.05, ##p < 0.01 versus the CSDS + Vehicle group

