Fig. 9.
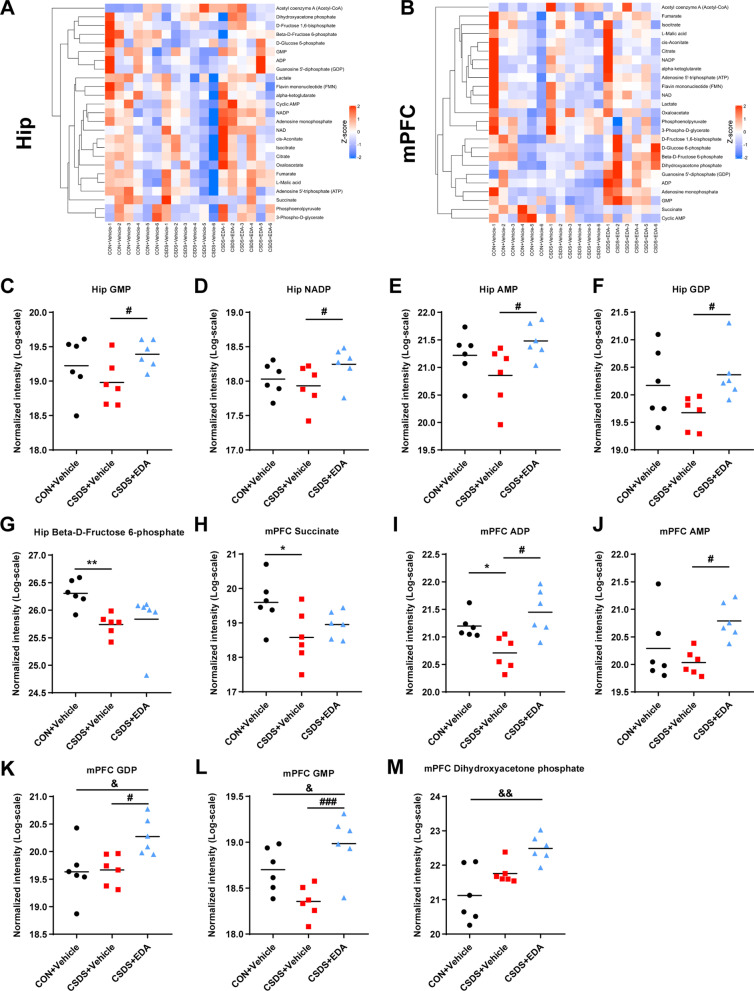
Targeted energy metabolomics in the Hip and mPFC of CSDS model mice. A Heatmap of partly energy-related metabolites in the Hip. B Heatmap of partly energy-related metabolites in the mPFC. Rows indicate metabolites. The degree of change in metabolite concentration is color coded. C–G Differential energy metabolites in the Hip. H–M Differential energy metabolites in the mPFC. Data are presented as mean ± SEM (n = 6 per group). *p < 0.05, **p < 0.01 versus the CON + Vehicle group. #p < 0.05, ###p < 0.001 versus the CSDS + Vehicle group. &p < 0.05, &&p < 0.01 versus the CSDS + EDA group

