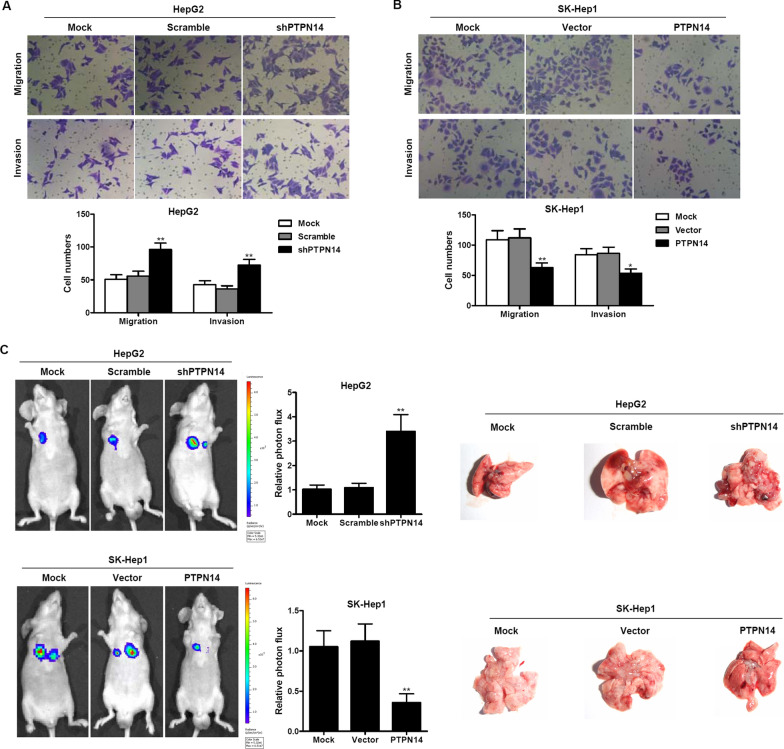
Fig. 3.
PTPN14 suppresses HCC invasion and migration in vitro and in vivo. The migration and invasion of HepG2 cells with stable PTPN14 knockdown (A) and SK-Hep1 cells with PTPN14 stable overexpression (B) was assessed by a Transwell assay. The number of migrating and invading cells was counted in at least three different fields per sample. The data are shown as the means ± SD (n = 3). *p < 0.05; **p < 0.01 compared with the respective controls. C The pulmonary metastasis of HepG2 cells with stable PTPN14 knockdown and SK-Hep1 cells with PTPN14 stable overexpression was monitored by bioluminescence imaging in vivo. Pulmonary metastasis was observed using a whole-body fluorescent imaging system. Right, gross view of lung metastatic nodules. Relative photon flux of the two groups was calculated. The data are shown as the mean ± SD (n = 5). **p < 0.01 compared with the respective controls

