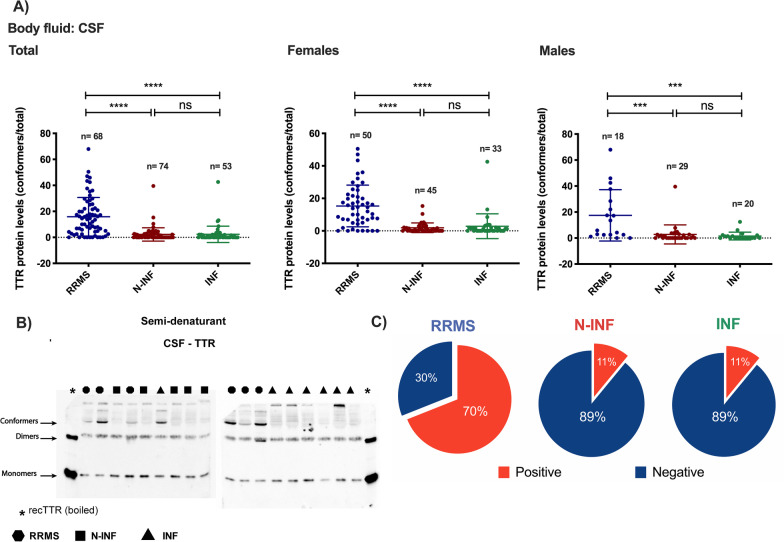
Fig. 9.
TTR profile in CSF samples from Relapse–remitting multiple sclerosis (RRMS), other inflammatory diseases of the CNS (INF) and with non-inflammatory diseases of the CNS (N-INF), analysed by western blot under semi-denaturating conditions. A, B CSF samples belonging to the three groups were subjected to PAGE followed by western blot with an anti-TTR antibody. The migration of TTR monomers, dimers and conformers is shown in the image. A Fraction of the total TTR immunoreactivity in the conformer form in CSF samples from the three groups. C Percentage of samples from the three groups showing TTR conformers (ns, p > 0.05; ***p < 0.001; ****p < 0.0001)

