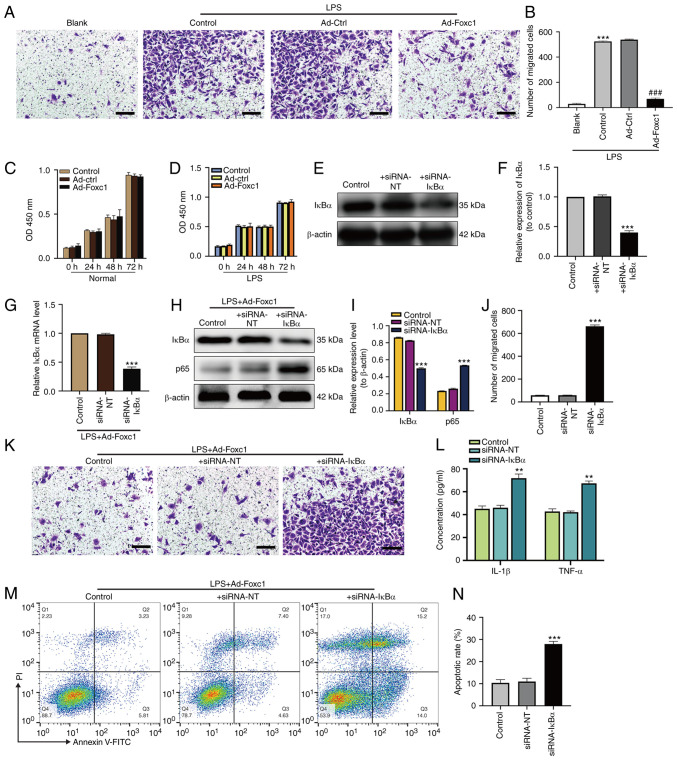
Figure 3.
Overexpression of Foxc1 inhibits LPS-induced microglial migration, inflammatory response and neuronal apoptosis through the NF-κB pathway. (A) Representative images showing migrated BV-2 microglial cells with or without Foxc1 overexpression under normal or LPS conditions using Transwell assays, (B) which were quantified. Scale bar, 50 µm. ***P<0.001 vs. blank group; ###P<0.001 vs. Ad-Ctrl group. Viability of BV-2 cells under (C) normal or (D) LPS conditions with or without Foxc1 overexpression were determined by the CCK-8 assay. After siRNA transfection, transfection efficiency was analyzed by (E) western blot analysis and (F) was semi-quantified. In the presence of LPS, BV-2 cells with Foxc1 overexpression were transfected with siRNA-IκBα or with siRNA-NT. Foxc1-overexpressing BV-2 cells without siRNA transfection were used as the control group. siRNA-mediated transfection efficiency on IκBα and p65 expression was determined by (G) reverse transcription-quantitative PCR and (H) western blot analysis, (I) the latter of which was quantified. (H) Quantification of BV-2 cell migration after Foxc1 overexpression in the presence of LPS using Transwell assays. (J) Representative Transwell assay images, (K) which were quantified. Scale bar, 50 µm. (L) After siRNA transfection, the secretion of IL-1β and TNF-α into the cell culture supernatant by BV-2 cells with Foxc1 overexpression in the presence of LPS was measured by ELISA. (M) Flow cytometry analysis of HT-22 cell apoptosis after incubation in the media conditioned by microglia. (N) The percentage of early and late apoptotic HT-22 cells was measured by flow cytometry analysis. Data represents the mean ± SD of three independent experiments. **P<0.01 and ***P<0.001 vs. + siRNA-NT group. LPS, lipopolysacharide; Ad-, adenovirus; Ctrl, control; siRNA, small interfering RNA; Foxc1, Forkhead box C1; IκBα, NF-κB inhibitor α.

