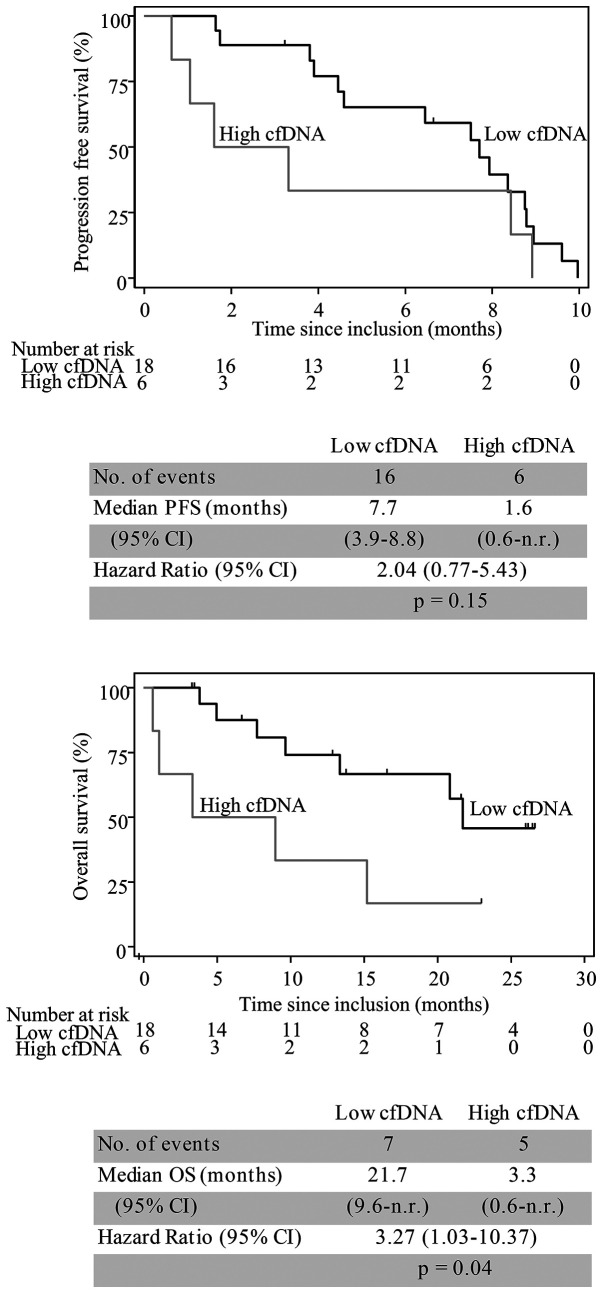
Figure 6.
Kaplan-Meier curves indicating the association between plasma cfDNA levels (ng/µl) and PFS and OS in 24 patients with metastatic colorectal cancer with liver involvement. Patients were dichotomized according to 75th percentile of cfDNA levels at baseline. Low cfDNA, <75th percentile; high cfDNA, ≥75th percentile. Tick marks indicate censored data. n.r., not reached; CI, confidence interval; cfDNA, cell-free DNA; PFS, progression-free survival; OS, overall survival.

