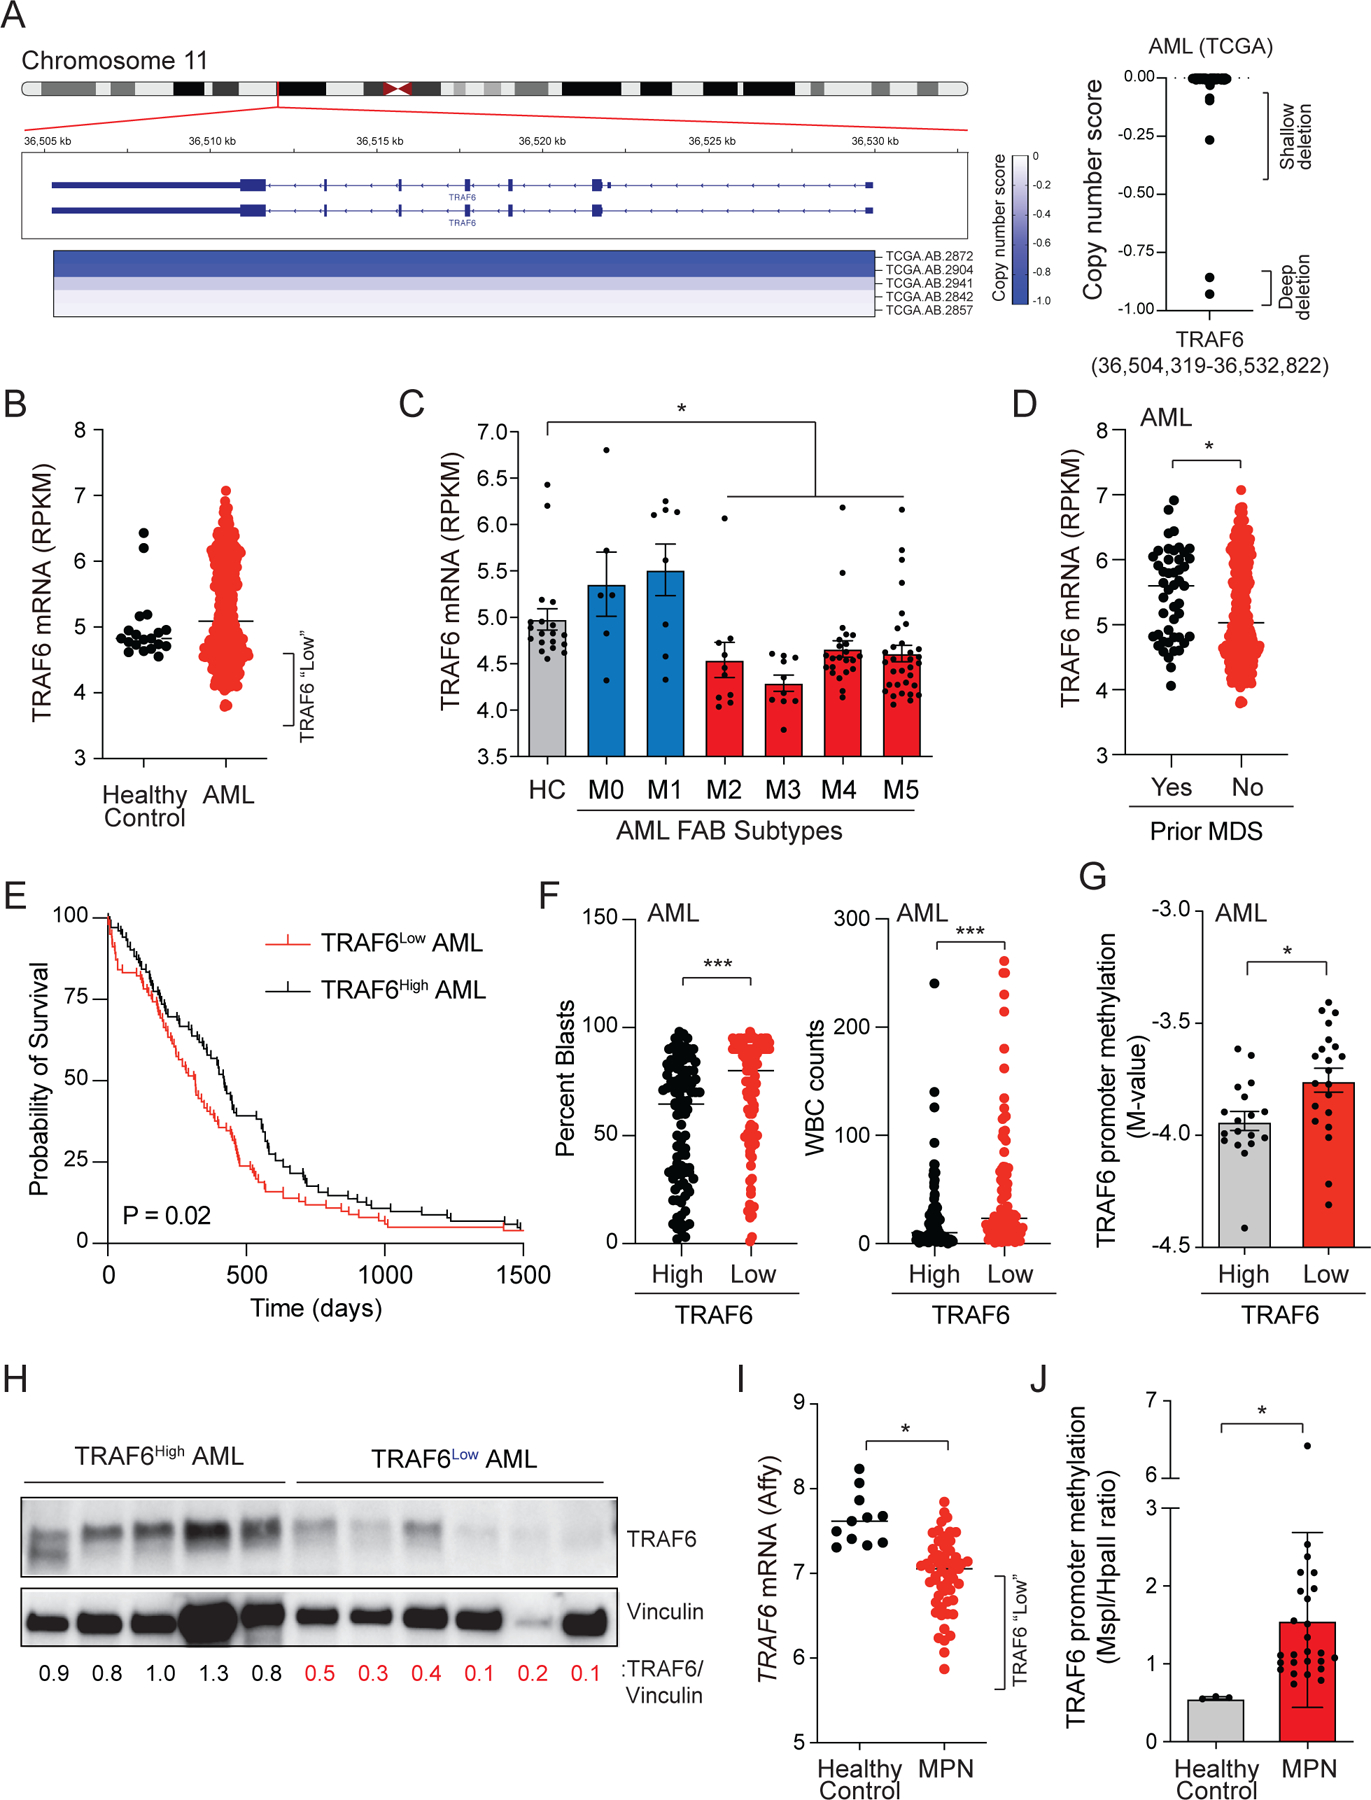
Figure 4. Reduced TRAF6 expression in human myeloid leukemia.

(A) Human chromosome 11p13 is shown for AML. The TRAF6 copy number score is depicted in the heatmap (TCGA sample numbers are indicated below). Negative scores indicate chromosome deletions. The copy number scores (<0) for TRAF6 are summarized for all AML patients within the TCGA data set (right panel). (B) TRAF6 mRNA expression in healthy age-matched BM CD34+ cells (n = 12) and AML (n = 451). (C) TRAF6 mRNA expression in AML stratified on FAB classification. (D) TRAF6 mRNA expression in de novo AML (“no”) and in AML patients with prior MDS (“yes”). (E) Overall survival of AML patients stratified on TRAF6 expression (highest/lowest 25%). (F) Percent blasts and WBC counts in AML patients stratified on TRAF6 expression (highest/lowest 25%). (G) TRAF6 promoter methylation in AML patients stratified on TRAF6 expression. (H) TRAF6 protein expression in primary AML. Relative TRAF6 expression was calculated by determining the densitometric values of TRAF6 as compared to Vinculin. (I) TRAF6 mRNA expression in healthy age-matched controls (n = 11) and MPN patients (n = 93). (J) TRAF6 promoter methylation in MPN patients and healthy controls. Error bars represent the S.E.M. Significance was determined with a Student’s T test for two groups or ANOVA for multiple groups (*, P < 0.05; **, P < 0.01; ***, P < 0.001).
