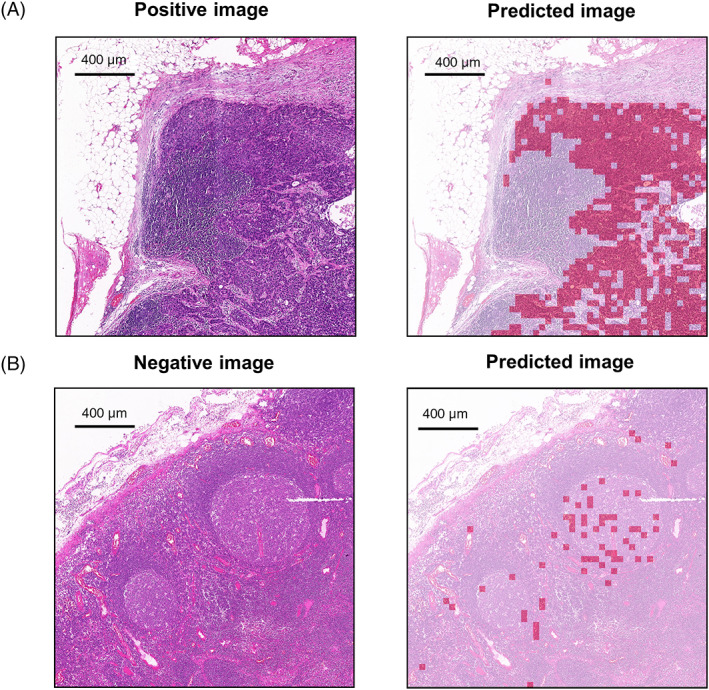
FIGURE 2.

Visualization of large‐scale lymph node histopathological images analyzed by the primary model. Here are representative examples of correct (A) and incorrect (B) annotation of large‐scale lymph node images in the training set using the primary model with a sliding window of 40 × 40 pixels. The original images are on the left. The merged images are on the right. The area predicted to be tumor is marked in red. The area predicted to be nontumor is marked in white
