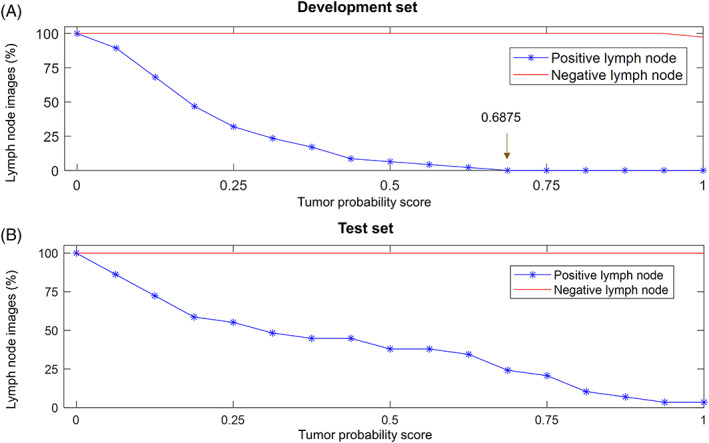
FIGURE 4.

Distribution of tumor probability scores. (A) Distribution of tumor probability scores in the development set. When the score threshold is between 0.6875 and 1, the sensitivity and specificity of the model are both 100%. We set the score threshold to 0.6875 of the lower bound. This means that the area with a score not lower than 0.6875 will be marked as metastatic disease, otherwise, it will be marked as normal tissue. (B) Distribution of tumor probability scores in the test set
