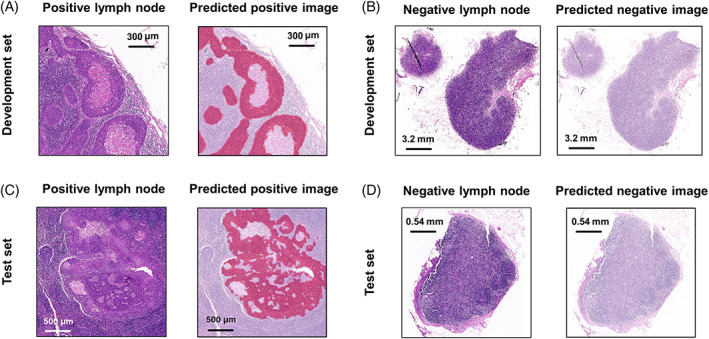
FIGURE 5.

Representative examples of the delineation of metastatic lesions by the diagnostic model. The areas detected as metastatic lesions are marked in red. The area detected as normal tissue is marked in white. (A) The metastatic lesions with accurate segmentation in the development set. (B) A correctly classified negative lymph node in the development set. (C) The metastatic lesions with accurate segmentation in the test set. (D) A correctly classified negative lymph node in the test set
