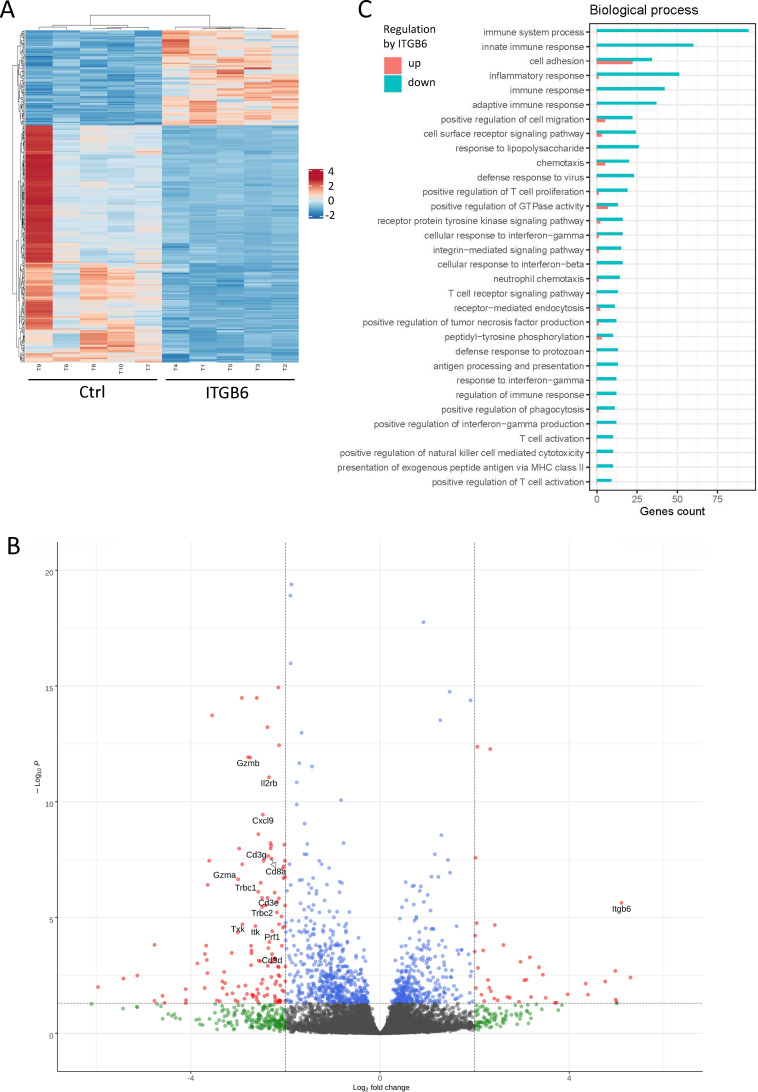
Figure 2.
Cytotoxic immune response regulation is the main function of ITGB6 within the tumor. (A) Heatmap of differentially expressed genes (DEGs) (p<0.001) in MC38-ITGB6 and MC38-Ctrl tumors, generated by unsupervised hierarchical clustering (n=5 mice). (B) Volcano plot displaying DEGs from MC38-ITGB6 versus MC38-Ctrl tumors. Y-axis corresponds to p value of –log 10. X-axis displays log 2-fold change value. Indicated limits represent DEGs with p<0.05 and log 2 fold change above +2 or below −2. (C) Gene ontology enrichment analysis of DEGs. Bars in red or blue indicate the number of genes involved in upregulation or downregulation of the respective biological process in ITGB6-expressing tumors.

