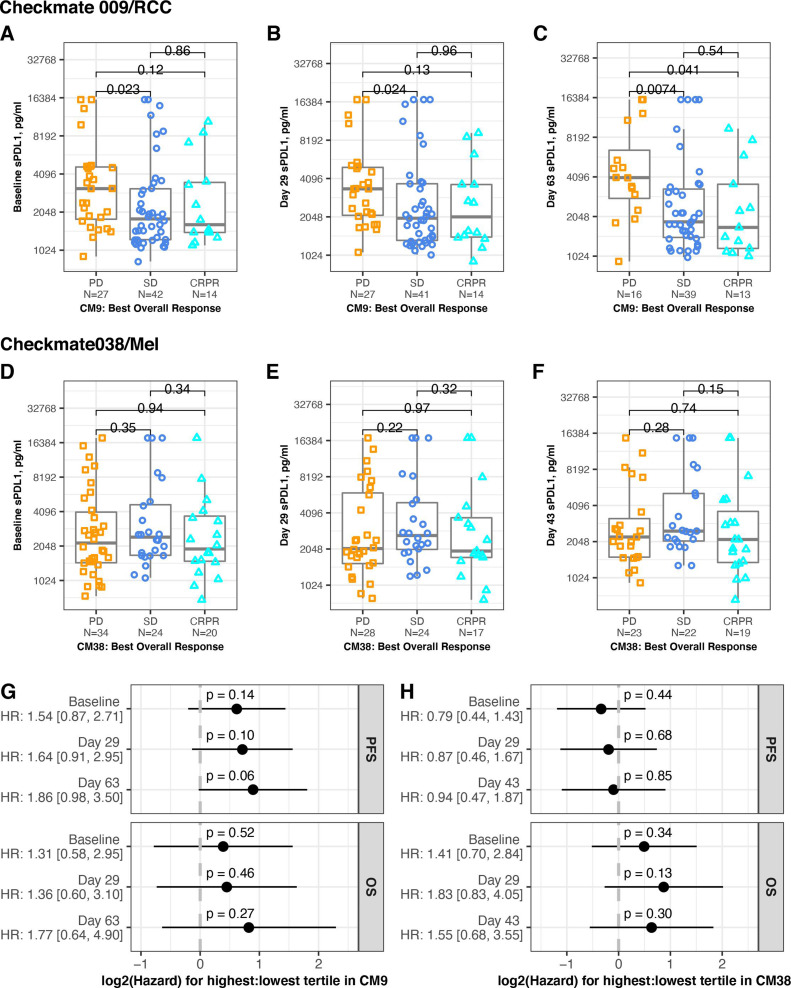
Figure 2.
Association between sPD-L1 and response. Serum level of sPD-L1 in patients from CheckMate 009 (upper panels) and CheckMate038 (middle panels). BOR is indicated by gold squares (PD), blue circles (SD) or aqua triangles (CR or PR). All p values are derived from Wilcoxon rank sum test. (A) Samples provided at baseline in CheckMate 009. Data are grouped by BOR (PD, SD or CRPR, n=27, 42, 14, respectively). (B) Samples provided at day 29 in CheckMate 009. Data are grouped by BOR (PD, SD or CRPR, n=27, 41, 14 respectively). (C) Samples provided at day 63 in CheckMate 009. Data are grouped by BOR (PD, SD or CRPR, n=16, 39, 13, respectively). (D) Samples provided at baseline in CheckMate 038-P1. Data are grouped by BOR (PD, SD or CRPR, n=34, 24, 20, respectively). (E) Samples provided at day 29 in CheckMate 038-P1. Data are grouped by BOR (PD, SD or CRPR, n=28, 24, 17, respectively). (F) Samples provided at day 43 in CheckMate 038-P1. Data are grouped by BOR (PD, SD or CRPR, n=23, 22, 19, respectively). (G) Cox proportional hazard analysis of survival in CheckMate 009, comparing patients from the highest tertile of sPD-L1 values to patients from the lowest tertile of values, for each timepoint indicated. Panel displays p value and zero-centered HR. HR and 95% CIs are indicated to left. (H) Cox proportional hazard analysis of survival in CheckMate 038-P1, comparing patients from the highest tertile of sPD-L1 values to patients from the lowest tertile of values, for each timepoint indicated. Panel displays p value and zero-centered HR. HR and 95% CIs are indicated to left. BOR, best overall response; CR, complete response; OS, overall survival; PFS, progression-free survival; PD, progressive disease; PR, partial response; SD, stable disease.

