Figure 3.
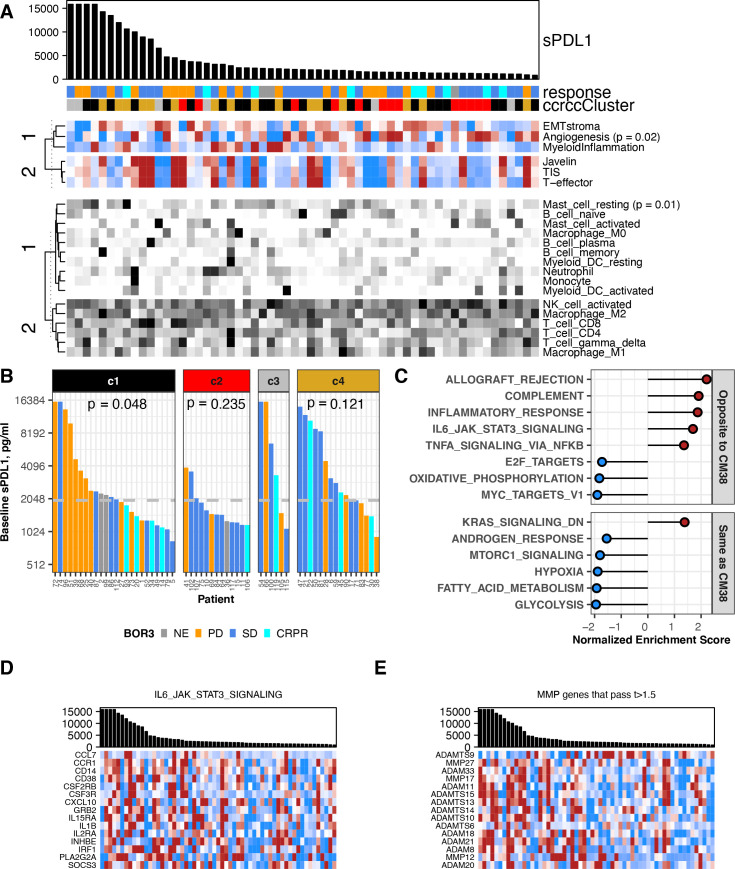
Association between baseline sPD-L1 and gene expression in RCC. All data shown are from 59 patients with a baseline value for sPD-L1 and gene expression data from a baseline biopsy in CheckMate 009. BOR is indicated by gold (PD), blue (SD), aqua (CR or PR) or gray (ND). (A) Biopsy samples are ordered by sPD-L1 level at baseline, provided in the barchart. sPD-L1 values from patients with PD as best response are indicated in gold. Upper heat-map panel shows scores for the gene sets indicated, clustered by their similarity. Scale is −1 to 1 (blue to red). Lower heat-map panel shows CIBERSORT values for the immune cell types indicated, clustered by their similarity. Scale is 0–0.5 (white to black). Sample annotation track shows predicted ccrcc subtype for the biopsy (ccrcc1 as black, ccrcc2 as red, ccrcc3 as gray, and ccrcc4 as gold). (B) Barchart shows sPD-L1 level at baseline. Data are grouped by assigned ccrcc subtype for the biopsy. The median value of sPD-L1 at baseline in all patients (1978 pg/mL) is indicated by a gray horizontal line. P values are from Kruskal-Wallis rank sum test for distribution of BOR in each ccrcc sybtype. (C) Normalized enrichment score from GSEA evaluating Hallmark pathway gene sets in the results for differential gene expression associated with baseline sPD-L1 level. Plot shows 14 pathways that were associated with sPD-L1 level in both CheckMate 009 and 038. Pathways showing the same direction of association are labeled in red. (D) Barchart shows sPD-L1 level at baseline. Heat-map panel shows z-scored expression data for the 15 transcripts from the Hallmark pathway ‘IL6 JAK STAT3 Signaling’ that were associated with baseline sPD-L1 level in both CheckMate 009 and 038. Scale is −1 to 1 (blue to red). (E) Barchart shows sPD-L1 level at baseline. Heat-map panel shows z-scored expression data for the 15 transcripts encoding metalloprotease enzymes that were associated with baseline sPD-L1 level in CheckMate 009 with t-value >1.5. Scale is −1 to 1 (blue to red). BOR, best overall response; CR, complete response; GSEA, Gene Set Enrichment Analysis; PD, progressive disease; PR, partial response; RCC, renal cell carcinoma; SD, stable disease.

