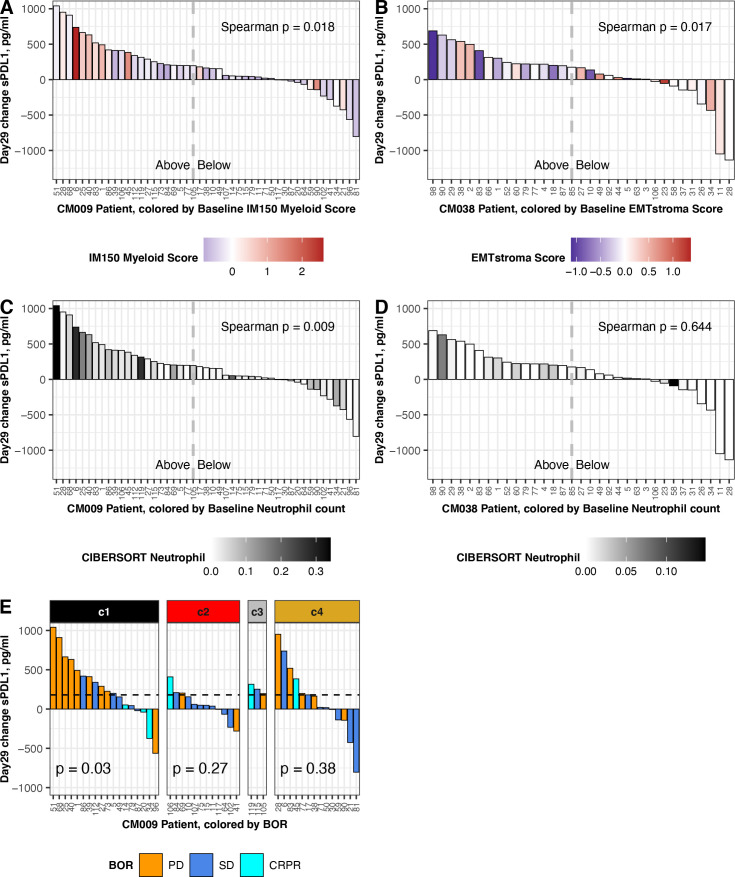
Figure 6.
Association between change in sPD-L1 and baseline gene expression. Data shown are from patients with baseline biopsy gene expression and a day 29 change result for sPD-L1. Left panels show data from CheckMate 009 (n=47; three outliers were omitted: 9159, 1887,–1943 pg/mL). Right panels show data from CheckMate 038-P1 (n=33; two outliers were omitted: 5280, 1769 pg/mL). Dashed lines indicate the median value of day 29 sPD-L1 change in the complete patient cohort: 180 pg/mL in CheckMate 009 and 175 pg/mL in CheckMate 038-P1 (table 1). (A) Change in sPD-L1 at day 29 in CheckMate 009, colored by Myeloid Inflammation Score in biopsy from respective patient. Scale is −1 to 2.5 (blue to red). (B) Change in sPD-L1 at day 29 in CheckMate 038-P1, colored by EMT/Stroma Score in biopsy from respective patient. Scale is −1 to 1.5 (blue to red). (C) Change in sPD-L1 at day 29 in CheckMate 009, colored by CIBERSORT value for Neutrophils in biopsy from respective patient. Scale is 0–0.35 (white to black). (D) Change in sPD-L1 at Day 29 in CheckMate 038-P1, colored by CIBERSORT value for Neutrophils in biopsy from respective patient. Scale is 0–0.15 (white to black). (E) Change in sPD-L1 at Day 29 in CheckMate 009. Data are partitioned by the assigned ccrcc subtype from the tumor biopsy. BOR is indicated by gold (PD), blue (SD) or aqua (CR or PR). P values are from Kruskal-Wallis rank sum test for distribution of BOR in each ccrcc sybtype. BOR, best overall response; CR, complete response; PD, progressive disease; PR, partial response; SD, stable disease.

