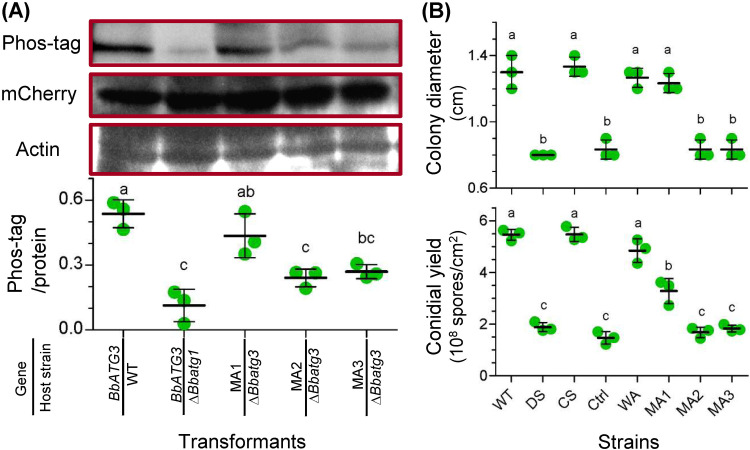
FIG 8.
Biochemical and physiological roles of the phosphorylation sites of B. bassiana ATG3. (A) To test the requirement of Atg1 for the Atg3 phosphorylation, BbATG3 was transformed into the WT and ΔBbatg1 mutant strains. To determine the phosphorylation sites in BbAtg3, two serine residues (S135 and S136) was mutated individually and simultaneously. The resultant genes with single mutations at S135 and S136 were designated MA1 and MA2, respectively, and the gene with double mutation was named as MA3. The mutated gene was fused to mCherry gene and transformed into the ΔBbatg3 mutant strain. (Top) Protein sample was resolved by SDS-PAGE and transferred onto a PVDF membrane. The phosphorylation signals were detected with the Phos-tag staining method. The mCherry protein level was determined using Western blotting, which also showed the BbAtg3 level. Actin was used as a reference for protein samples. (Bottom) The band intensity of Phos-tag and protein staining was determined, and their relative value was used to evaluate the phosphorylation level. (B) Roles of phosphorylation sites in fungal tolerance of oxidative stress (top) and conidiation (bottom). The assay was first performed in the WT, ΔBbatg3 (DS), and complementation (CS) strains. To test the roles of the phosphorylation sites, mutated genes (MA1, MA2, and MA3) were integrated into the ΔBbatg3 mutant strain. Additionally, the wild-type ATG3 (WA) and mCherry gene (Ctrl) were used as positive and negative controls, respectively. Oxidative stress was established by including menadione (0.02 mM) in CZA medium. Colony diameter was measured at 7 days postincubation. Conidial production was examined by incubating fungal strains on SDAY plates for 7 days. Lowercase letters indicate a significant difference between the different strains (Tukey’s honestly significant difference [HSD]; P < 0.05). Error bars: standard deviation.

