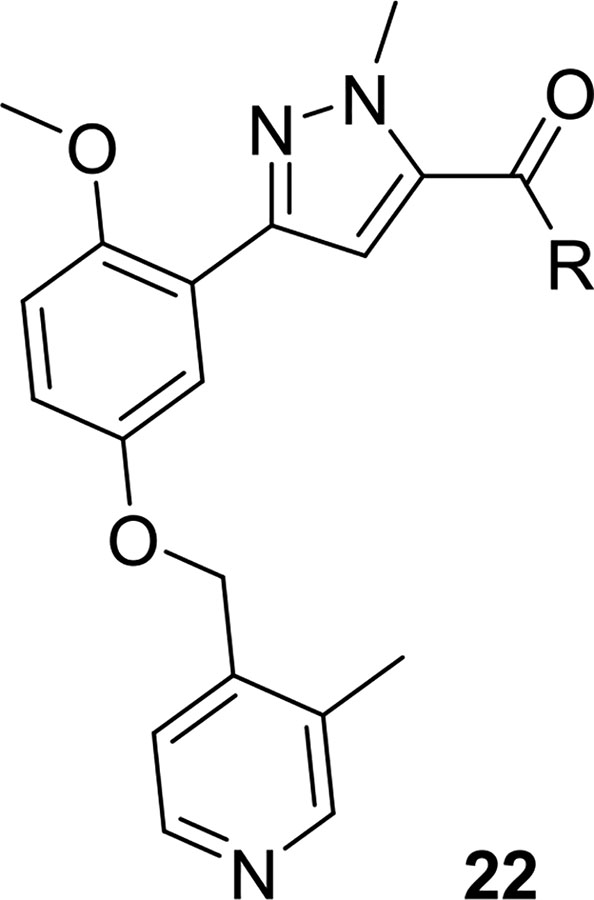
Table 3.
Structure and Activities of Analogs 22a
| Compound | R | PAR4-AP PAC-1 IC50 (μM)b (pIC50±SEM) | PAR4-AP % Max PAC-1a | PARI %Maxc |
|---|---|---|---|---|
| 7 | 0.18 (6.74±0.06) | 0.32 | 98 | |
| 22a |

|
0.32 (6.49±0.03) | 0.66 | 84 |
| 22b |
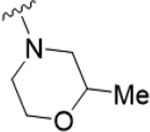
|
2.4 (5.61±0.13) | 5.1 | 80 |
| 22c |
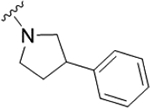
|
0.16 (6.79±0.04) | −1.2 | 92 |
| 22d |
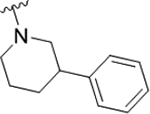
|
0.63 (6.2±0.09) | 1.3 | 81 |
| 22e |
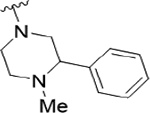
|
2.1 (5.67±0.10) | 11 | 90 |
| (5.67±0.10) | ||||
| 22f |

|
0.24 (6.61±0.05) | 0.32 | 92 |
| 22g |
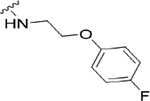
|
1.3 (5.88±0.13) | 4.2 | 85 |
| 22h |
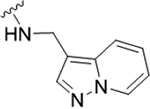
|
1.2 (5.92±0.11) | 2.84 | 76 |
Values indicate the percentage of max PAC-1 binding after PAR4-AP stimulation of human platelets.
Average of three independent determinations.
Values indicate the percentage PAR1 activity in the presence of 10 μM compound.

