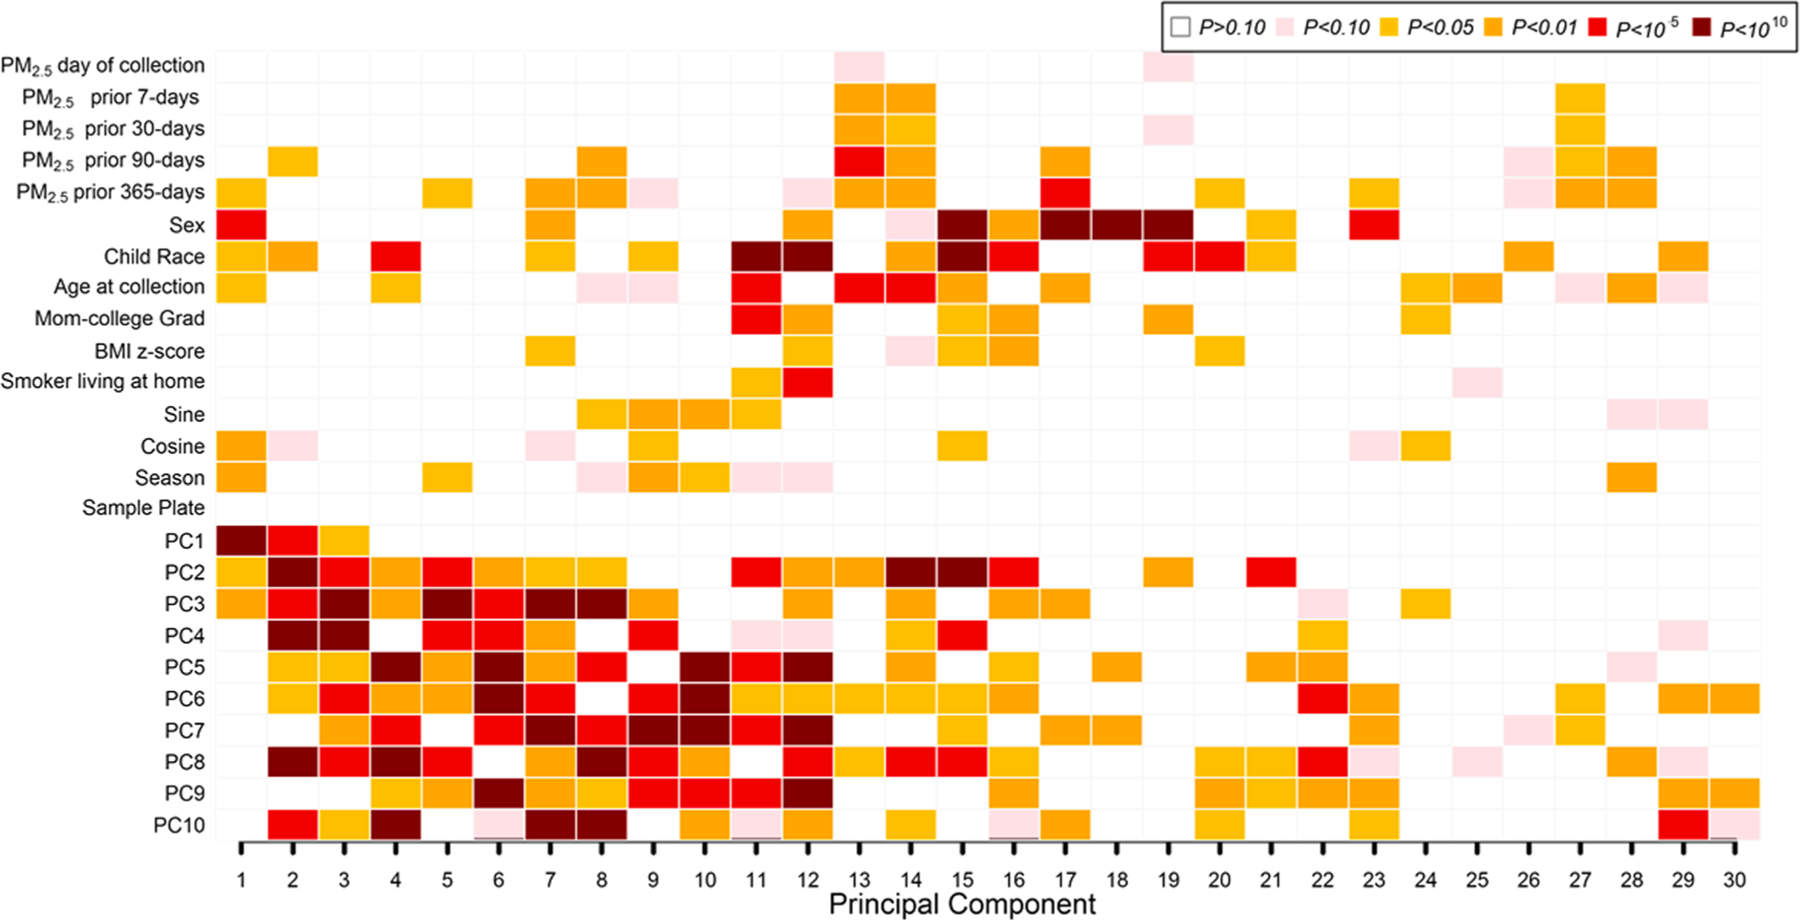
Fig. 1.

Associations of PM2.5 exposures, participant characteristics, and cell type heterogeneity with Global Nasal DNA methylation (DNAm) variability. PCs 1–10 on the vertical axis reflect DNAm differences in cell types estimated using the bio-informatic method ReFACTor. Univariate regression analysis (with global DNA methylation principal components as outcomes) was performed. P values for univariate associations between all covariates of interest and the top 30 global DNA methylation PCs (shown on the horizontal axis) are color-coded by smallest P value (dark red; P < 10–10) to largest (blank; P > 0.10). In all, global DNA methylation principal components explained 59% of the variance of the nasal DNA methylation data in the x-axis.
