. 2021 Dec 15;4(1):e200231. doi: 10.1148/ryai.200231

Figure 5:

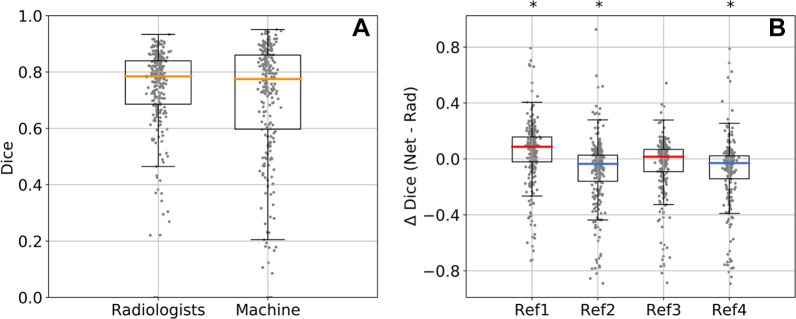
Network (net) and radiologist (rad) performance on the test set of 250 malignant cases. (A) Distribution of Dice scores in 250 test cases averaged across four reference segmentations. (B) Difference in Dice score between the network and each radiologist (Δ Dice) for each of the four reference (ref) segmentations (ref1, ref2, ref3, and ref4). The median Dice value was higher for the network for ref1 and ref3 (red median Δ Dice) and higher for the radiologist for ref2 and ref4 (blue median Δ Dice). Box plots show median (orange, red, or blue lines), quartiles (box), and 1.5 interquartile range (whiskers). *P < .001 (Wilcoxon signed rank test).

Network (net) and radiologist (rad) performance on the test set of 250 malignant cases. (A) Distribution of Dice scores in 250 test cases averaged across four reference segmentations. (B) Difference in Dice score between the network and each radiologist (Δ Dice) for each of the four reference (ref) segmentations (ref1, ref2, ref3, and ref4). The median Dice value was higher for the network for ref1 and ref3 (red median Δ Dice) and higher for the radiologist for ref2 and ref4 (blue median Δ Dice). Box plots show median (orange, red, or blue lines), quartiles (box), and 1.5 interquartile range (whiskers). *P < .001 (Wilcoxon signed rank test).