. 2021 Dec 15;4(1):e200231. doi: 10.1148/ryai.200231

Figure 6:

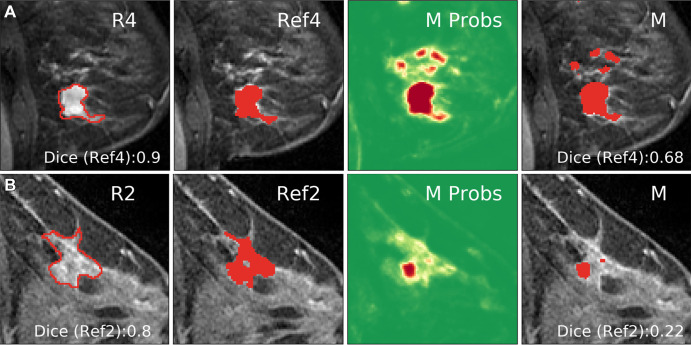
Examples of cases in which the network deviated from the segmentation of the reference radiologist (ref). (A) The network captured additional areas not selected by radiologist 4 (R4). Dice score shown for Ref4 (intersection of R1–R3). (B) The network output (M Probs) captured the correct area, but low probability values yielded a smaller region compared with the consensus segmentation (Ref2) after thresholding.

Examples of cases in which the network deviated from the segmentation of the reference radiologist (ref). (A) The network captured additional areas not selected by radiologist 4 (R4). Dice score shown for Ref4 (intersection of R1–R3). (B) The network output (M Probs) captured the correct area, but low probability values yielded a smaller region compared with the consensus segmentation (Ref2) after thresholding.