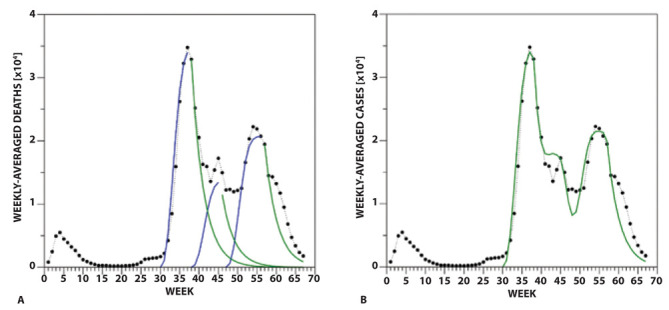
Figure 4.

(A) Modeling of the three subphases of Phase 2 of the curve of cases with mathematical functions. For the rises, sigmoidal functions making use of exponent 2.5 and time constant 4.1 were exploited. The time constant 3.2 was employed for the falls of the three Phase 2 subphases. (B) Model (sum of the 3 modeled subphases) superimposed to the real data.
