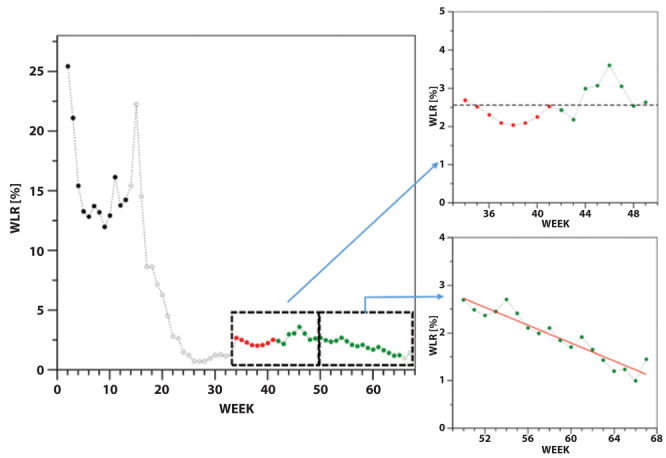
Figure 5.

Weekly lethality rate (WLR) evolution in the overall pandemic. The WLR values were calculated applying a 1-week (black and grey), 2-week (red), and 3-week (green) shift between positive test and death in the time intervals W2-W33, W34-W41, and W42-W67, respectively. Values computed for the weeks (W14-W33, W66-W67) with less than 70 weekly-averaged deaths are in light grey. The average WLR value (2.56%) detected in the time interval W34-W49 is shown as a dashed line. The linear regression analysis of the WLR values in the weeks W50-W67 provides a correlation coefficient R=-0.95 (p-value<10-5). The regression line (y = 7.4091 - 0.093675 x) is shown in red.
