Figure S3.

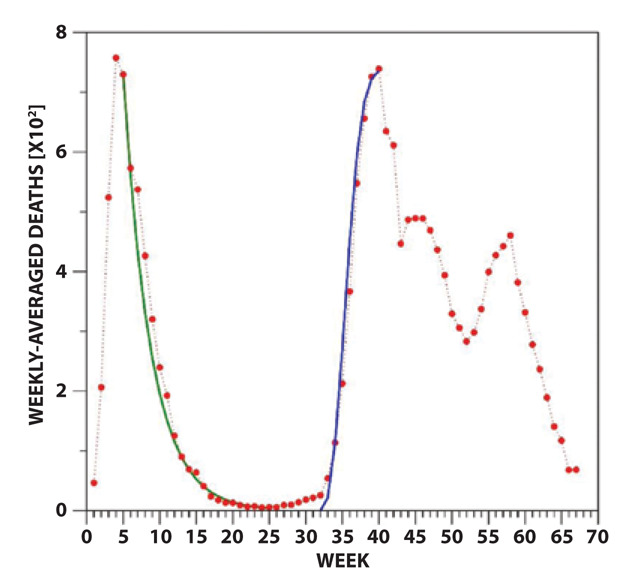
Modeling of the lockdown-driven fall of Phase 1 and the rise of Subphase 2.1 of the curve of deaths with a decreasing exponential (time constant 3.8) and a sigmoidal (exponent 2.5 and time constant 4.1) function, respectively.

Modeling of the lockdown-driven fall of Phase 1 and the rise of Subphase 2.1 of the curve of deaths with a decreasing exponential (time constant 3.8) and a sigmoidal (exponent 2.5 and time constant 4.1) function, respectively.