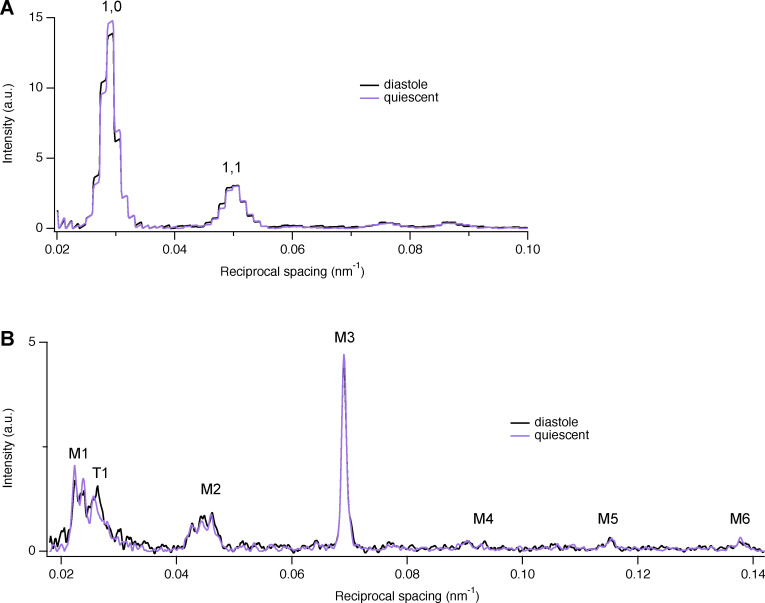
Figure S1.
Equatorial and meridional intensity distributions from the same trabecula either quiescent or in the diastolic phase between beats. (A and B) Equatorial (A) and meridional (B) intensity distributions (black; stimulation frequency, 1 Hz; purple, quiescent). Temperature, 27°C. The steplike appearance of the equatorial reflections is due to the horizontal 8× binning of the detector pixels before readout as explained in Materials and methods. Total exposure time, 40 ms. a.u., arbitrary unit.

