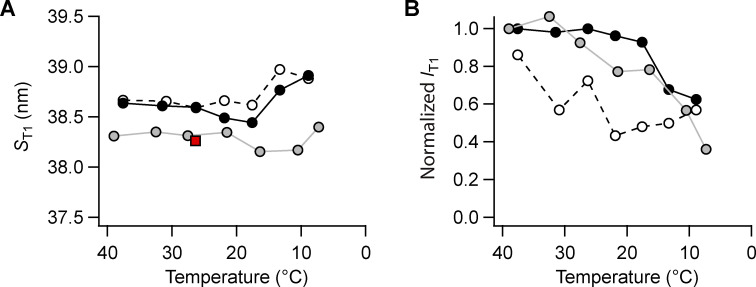
Figure S6.
Effect of cooling on the T1 reflection. (A and B) T1 spacing (ST1; A), total intensity (IT1; B). Gray symbols, intact trabeculae; black symbols, demembranated trabeculae in the presence (filled symbols) or absence (empty symbols) of Dextran. Data added n = 5 intact and n = 4 demembranated trabeculae. Red square in A, diastolic value in intact trabeculae paced at 1 Hz; T = 26.4°C; data added from n = 6 trabeculae. Intensities normalized by the value at 39/38°C in intact trabeculae and in demembranated trabeculae in the presence of Dextran.

