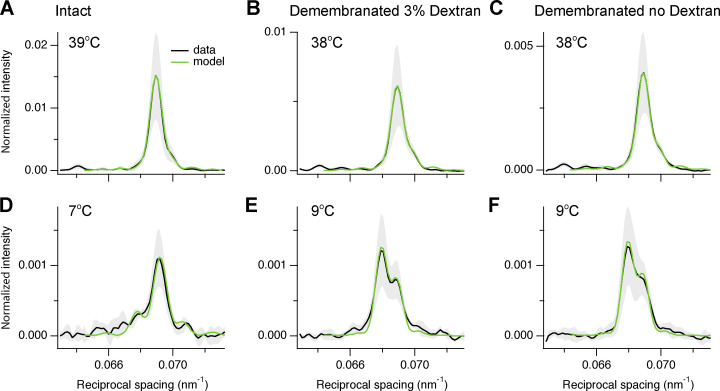
Figure S8.
Fitting the axial profile of the M3 reflection with a structural model of the thick filament. (A–F) Experimental axial profiles (black) of the M3 reflection from intact trabeculae (A and D), demembranated trabeculae in the presence (B and E) and absence (C and F) of 3% Dextran with superimposed best fits from the model (green). Temperature, 39–38°C (A–C) and 7–9°C (D–F). Data are mean ± SD (grey shading) and were averaged from n = 4 trabeculae after normalization for I10 at 39°C and 38°C in intact (A and D) and in demembranated trabeculae in the presence of Dextran (B and C and E and F), respectively.

