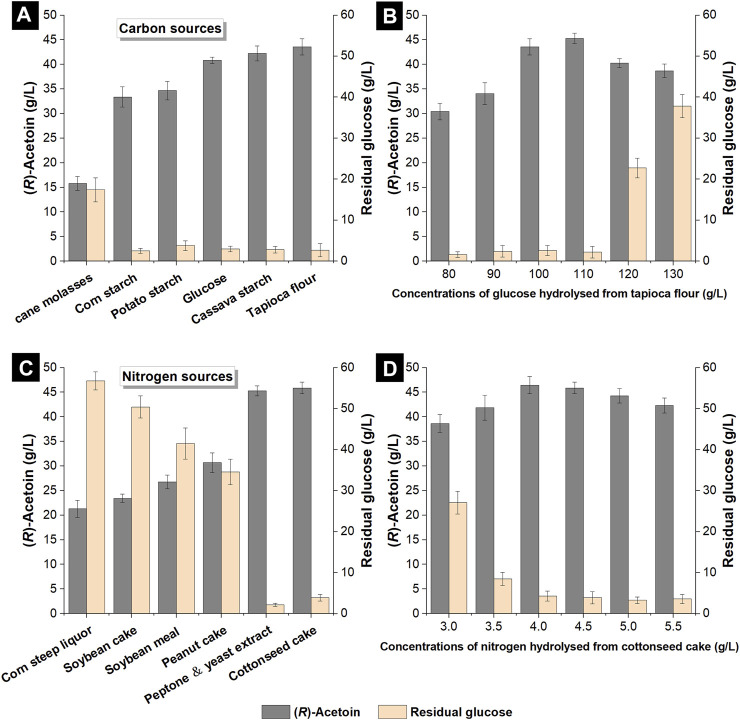
FIGURE 3.
Effects of different carbon and nitrogen sources from hydrolysates of cheap raw materials on the production of (R)-AC by GXASR11 in 250 ml shake flasks at 250 rpm and 37°C. (A) various carbon sources (B) effects of glucose concentrations on (R)-AC production (C) various nitrogen sources (D) effects of nitrogen concentrations on (R)-AC production.

