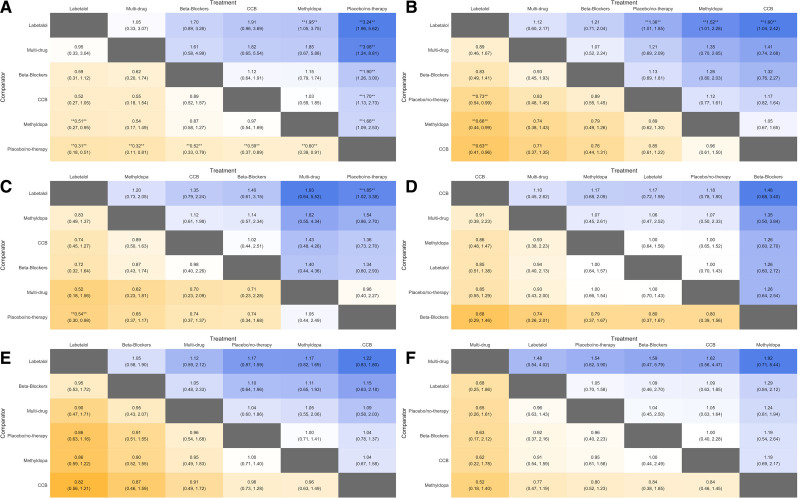
Figure 1.
League table comparing primary drugs of interest with placebo/no therapy and with each other. All estimates are odds ratios (OR) and 95% credible intervals. Outcomes are (from top left to bottom right): severe hypertension (A), proteinuria (B), perinatal death (C), small-for-gestational age infants (D), preterm birth (E), and neonatal care unit admission (F). Blue represents an OR >1.0 and orange an OR <1.0, stronger effects are illustrated by darker colors, drugs with more favourable effects are located in columns to the left, and statistically significant results (at P<0.05) are marked by double asterisks.

