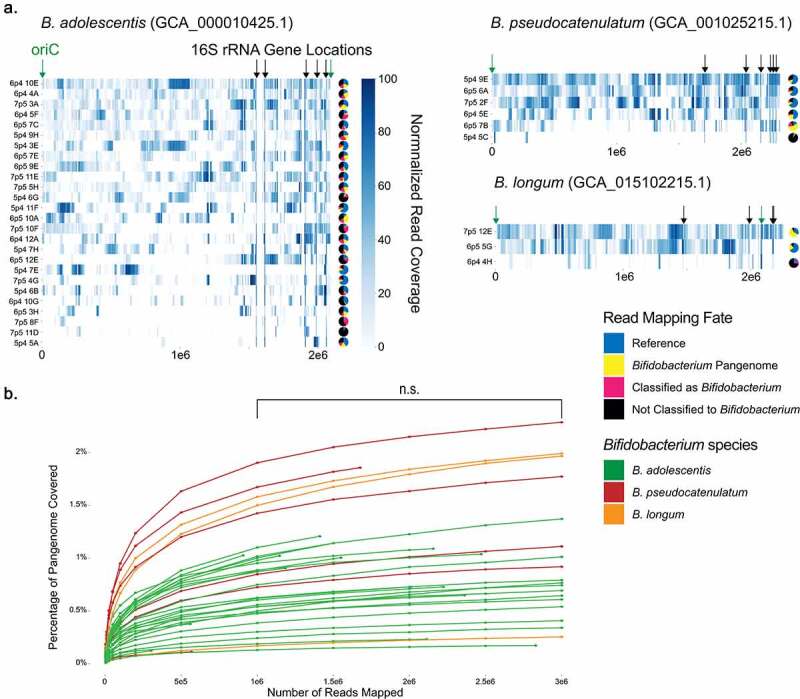
Figure 3.

Analysis of Bifidobacterium single cells reveals variable genomic coverage. (a) Read coverage of 35 individual cell reads mapped against 16S rRNA gene V4 amplicon-matched reference genomes by bowtie2. Read coverage displayed as a heatmap with each bp represented. Overall genomic coverage ranged from 1.3% to 82%. Locations of 16S rRNA genes and origin of replication (oriC) on the genomes are indicated. Pie charts represent the proportions of reads for each sample as mapped to the reference genome, mapped to the Bifidobacterium pangenome, classified by MMSeqs2 as Bifidobacterium, or classified by MMSeqs2 as another taxon or left unclassified. (b) Rarefaction curve of Bifidobacterium pangenome coverage for each single-cell sample at increasing read depth. Between 1,000,000 and 3,000,00 reads there was no significant improvement in genomic coverage (p = 0.91 by Tukey’s test.).
