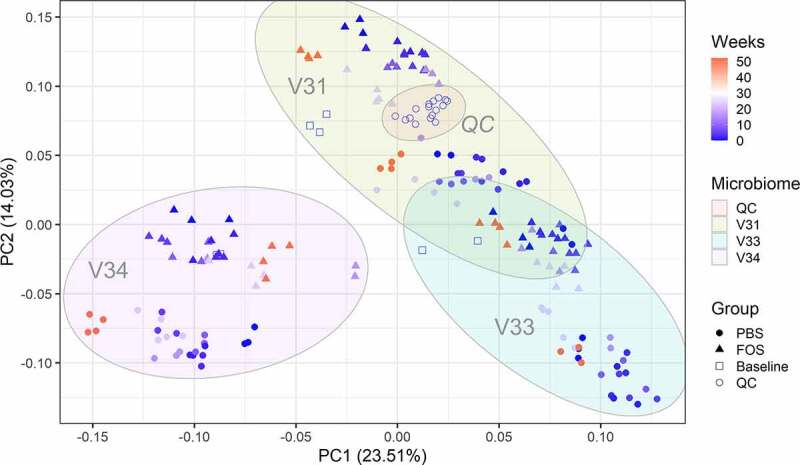
Figure 2.

Principal component analysis (PCA) score plot of quantified functional orthologs of baseline and cultured microbiomes using fresh or frozen biobanked stools. The log10-tranformed LFQ intensities of COGs that were quantified in >50% samples were used for PCA analysis. Different symbol colors indicate the weeks of frozen in −80°C prior to culturing, and different shapes indicate the treatment groups for each culturing experiment. Baseline, uncultured microbiome samples; FOS, fructo-oligosaccharide treatment group; PBS, phosphate buffered saline treatment group. QC, quality controls for monitoring mass spectrometry measurement performance; V31, V33 and V34, origin donors of the microbiome samples.
