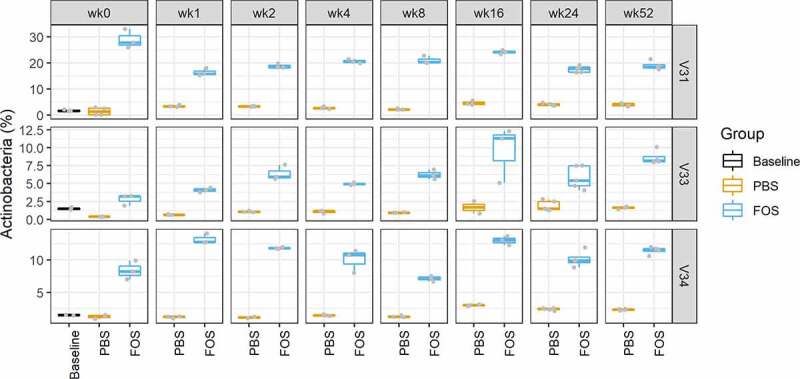
Figure 5.

Relative abundances of Actinobacteria in baseline and cultured microbiomes using fresh or frozen biobanked stools. Baseline, uncultured microbiome samples; FOS, fructo-oligosaccharide treatment group; PBS, phosphate buffered saline treatment group. V31, V33 and V34, origin donors of the microbiome samples. Column facet grid names (wk0, 1, 2, 4, 8, 16, 24 and 52) indicate the weeks of frozen in −80°C prior to culturing. Box plots were generated using ggplot2 with data points overlapped with the boxes. The first and third quantiles were indicated as the box width and median was also displayed in the middle of box. Upper and lower whiskers indicate the smallest value ≥1.5 interquartile range (IQR) and largest value ≤1.5 IQR, respectively.
