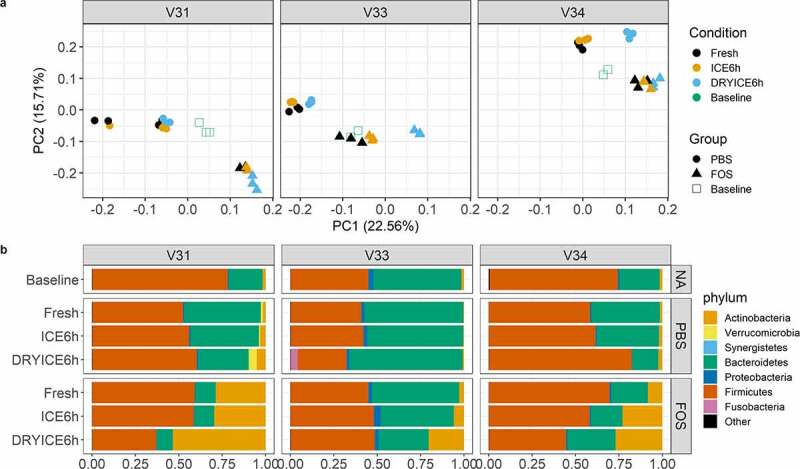
Figure 6.

Effects of delayed fecal sample processing on the cultivability of microbiomes. (a) Principal component analysis (PCA) score plots of quantified protein groups. Baseline, uncultured microbiome samples; FOS, fructo-oligosaccharide treatment group; PBS, phosphate buffered saline treatment group. V31, V33 and V34, origin donors of the microbiome samples; Fresh, culturing with fresh stools; ICE6h, culturing with stools stored on ice for 6 hours; DRYICE6h, culturing with stools stored on dry ice for 6 hours. (b) Phylum level taxonomic compositions as calculated using metaproteomic data. Group average of relative abundances was used for plotting. NA indicated no treatment/culturing for baseline samples. Different colors indicate different phyla as shown in the legend at the bottom.
