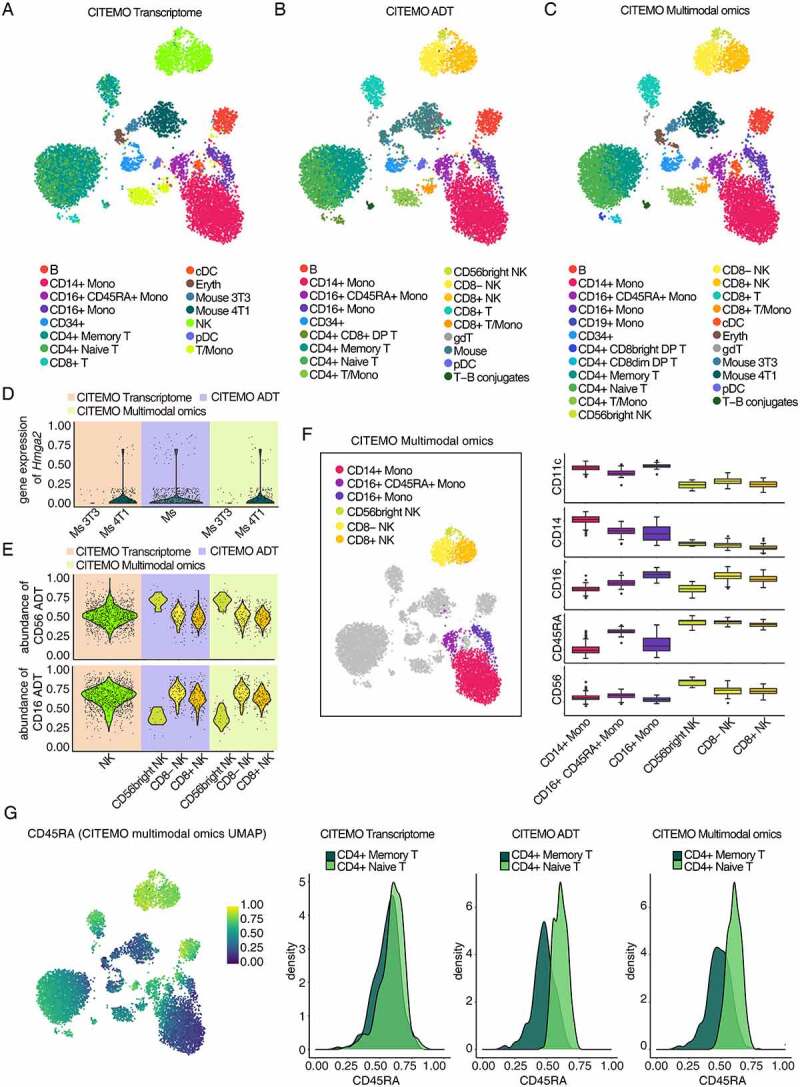
Figure 2.

Characterizing heterogeneity with CBMC sample. (A-C) UMAP visualizations of clustering results. The annotation of cell clusters was analysed by CITEMO using transcriptome modality (A), ADT modality (B) and multimodal omics (C) data. (D) Violin plots of Hmga2 gene expression in mouse cell clusters. (E) Violin plots of CD56 (up) and CD16 (down) ADT abundance in NK cell clusters. Different background colours in (D) and (E) indicate that different modalities were used for clustering analysis by CITEMO. (F) The clustering results of NK cells and Monocytes obtained by CITEMO multimodal omics on the left, and the box plots on the right showing the different ADT abundance of the NK cells markers of CD56 and CD16, the Monocytes markers of CD11c and CD14, and a proliferating marker CD45RA in six distinct clusters. (G) A feature plot of CD45RA ADT abundance with CITEMO multimodal omics UMAP shown on the left, and the density distributions of CD45RA ADT in CD4+ Memory T cells and CD4+ Naïve T cells under the indicated modalities given on the right.
