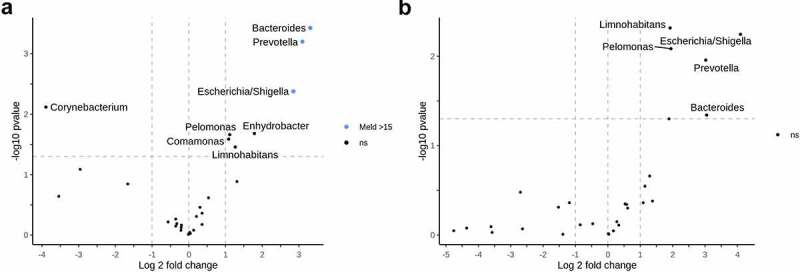
Figure 5.

Circulating microbiome and MELD score.
Differential relative abundance testing according to the severity of cirrhosis. A volcano plot a) represents genera with significantly different relative distribution between patients with MELD score >15 and <15 in hepatic vein blood; b) – in peripheral blood. The x‐axis shows the log2 fold change, y‐axis displays the – log 10 transformed P‐value. Taxa were considered differentially abundant when reaching a Padj <0.05 and absolute log 2-fold change >1. Positive log 2-fold changes indicate genera with higher abundance in patients with MELD score >15. Genera which did not withstand multiple comparison testing are above the horizontal line, non-colored and marked as ns. Abbreviations: MELD – Model for End-Stage Liver Disease, ns – not significant
