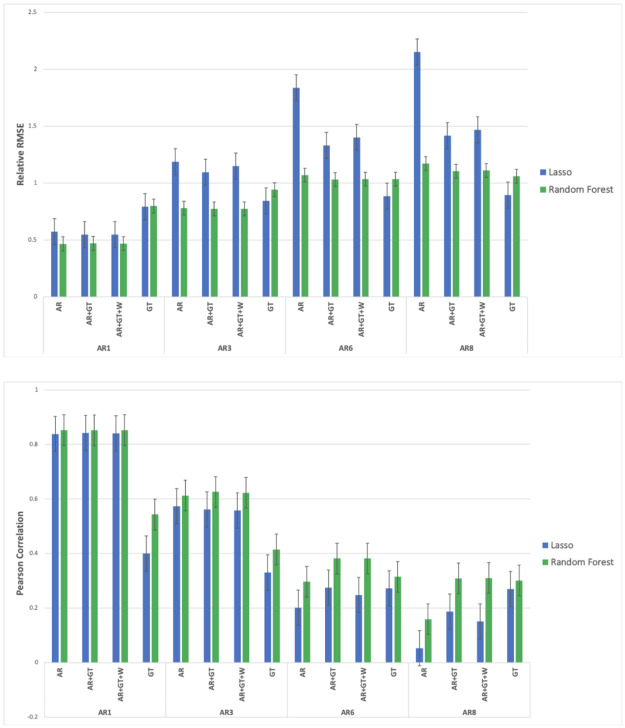
Fig 2. A comparison of Random Forest- and Lasso-based model performance.
The mean is taken across the different cities, with the fill range of delays in availability of epidemiological information (from eight weeks, AR8, to one week, AR1) and the different feature sets (AR, GT AR+GT, AR+GT+W) shown.

