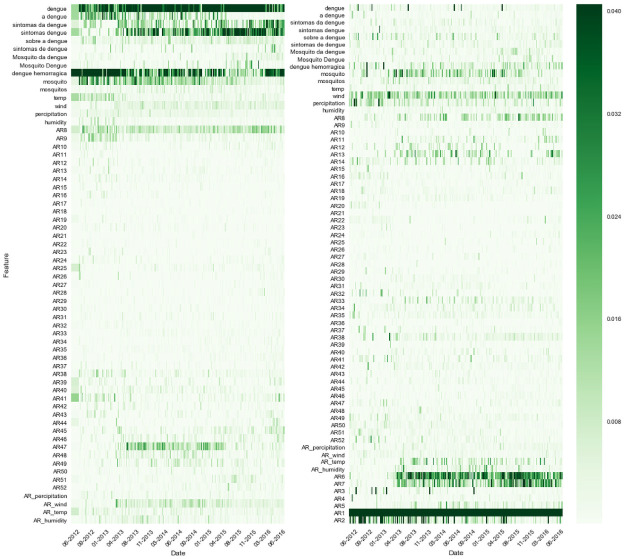
Fig 4. Change in the relative importance of different predictors over time.
Barra Mansa, Random Forest model with full feature set (autoregressive epidemiological data, google trends data, and weather data). Left: An assumed delay of 8 weeks in the availability of epidemiological data. Right: An assumed delay of 1 week in the availability of epidemiological data.

