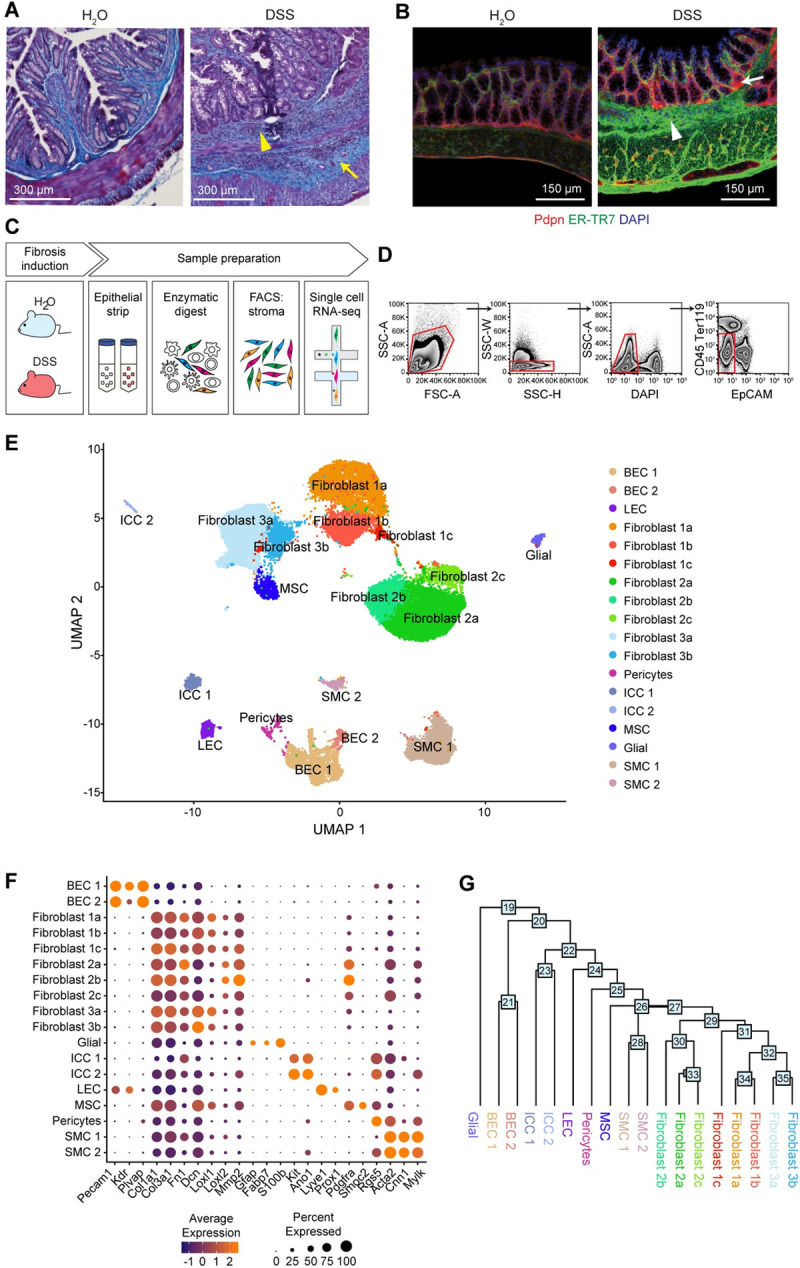
Fig 1. A cellular census of stromal cells in healthy and inflamed mucosal tissues.

(A) Masson’s trichrome staining of colon from water- and chronic DSS (3 rounds)-fed mice. Collagen accumulation in blue, as demarcated by yellow arrows. Leukocyte infiltrates, as demarcated by yellow arrowheads. n = 2, Scale bar, 300 μm. representative of 2 experiments. (B) IF staining of colon from water- and chronic DSS-fed mice. DAPI (blue), Pdpn (red), ER-TR7 (green). ECM deposition, as demarcated by white arrowhead. Pdpn+ cell expansion, as demarcated by white arrow. Scale bar, 150 μm. n = 3. (C) Workflow depicts colon processing, epithelial strip, mechanical and enzymatic digestion dissociation, and sorting to enrich for stromal cells. (D) Gating strategy for FACS to enrich for colon stromal cells (DAPI− CD45− Ter119− EpCAM−) prior to performing single-cell transcriptomics. (E) Single-cell atlas of the murine colonic stroma. UMAP of approximately 34,000 single-cell (dots) profiles colored by cell type assignment. (F) Expression of common stromal marker genes across cell type subsets. Color represents average expression of marker gene within clusters; diameter represents percentage expression of marker gene within cluster. (G) A dendrogram of cell subset relationships based on the single-cell transcriptomic data. Numbers at nodes represent score of how closely related the clusters are, with the higher the number indicating transcriptional similarity. DSS, dextran sulfate sodium; ECM, extracellular matrix; IF, immunofluorescence; UMAP, uniform manifold approximation and projection.
