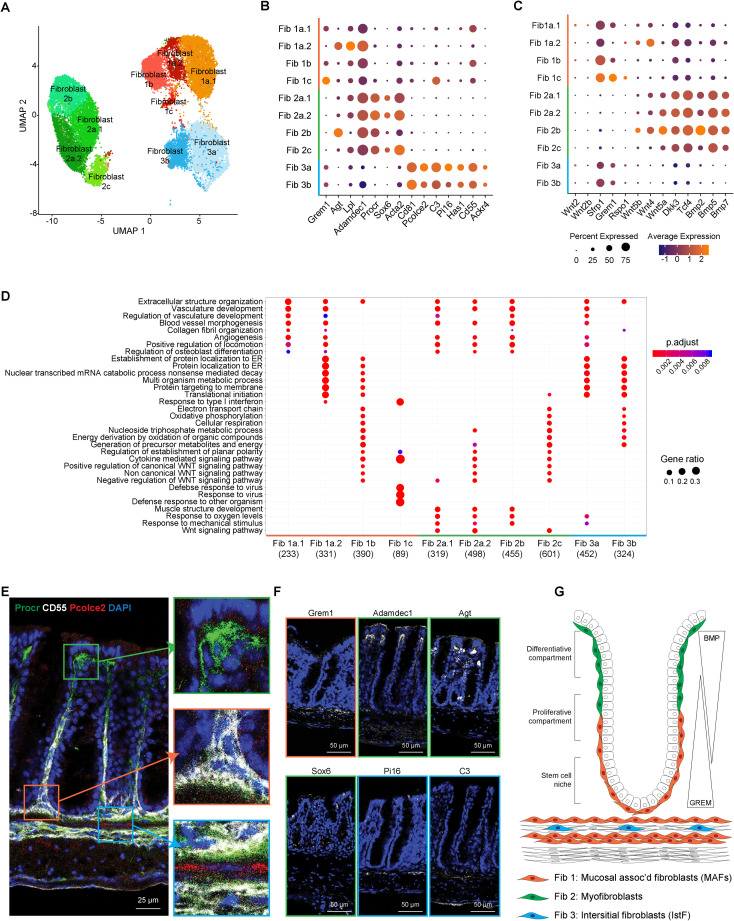
Fig 3. Single-cell profiling reveals functional and spatial heterogeneity of colonic fibroblasts.
(A) Single-cell atlas of colon fibroblasts. UMAP of fibroblast (dots) profiles colored by cell type assignment. (B) Expression of canonical and newly characterized markers across fibroblast clusters. Color represents average expression of marker gene within clusters; diameter represents percentage expression of marker gene within cluster. (C) Expression of genes involved in maintaining colon crypt architecture. Color represents average expression of marker gene within clusters; diameter represents percentage expression of marker gene within cluster. (D) GO enrichment of DEGs for each fibroblast cluster at baseline (water-fed mice). (E) IF staining of 3 fibroblasts classes from water-fed mouse colon. Boxes zoom onto fibroblast subsets: green box- fibroblast class 1, orange box- fibroblast class 2, and blue box- fibroblast class 3. Pcolce2 (red), CD55 (white), Procr (green), DAPI (blue). Scale bar, 25 μm. n = 3. (F) IF and FISH of various markers for fibroblast subsets. Fibroblast 1 (orange box): Grem1 (FISH). Fibroblast 2 (green box): Adamdec1 (IF), Agt (FISH), and Sox6 (IF). Fibroblast 3 (blue box): Pi16 (FISH), C3 (IF). Denoted stain (white), DAPI (blue). Scale bar, 50 μm. n = 3. (G) Proposed distribution of 3 fibroblast classes within the colon. BMP, bone morphogenetic protein; DEG, differentially expressed gene; FISH, fluorescence in situ hybridization; GO, gene ontology; IF, immunofluorescence; IstF, interstitial fibroblast; MAF, mucosa-associated fibroblast; UMAP, uniform manifold approximation and projection.

