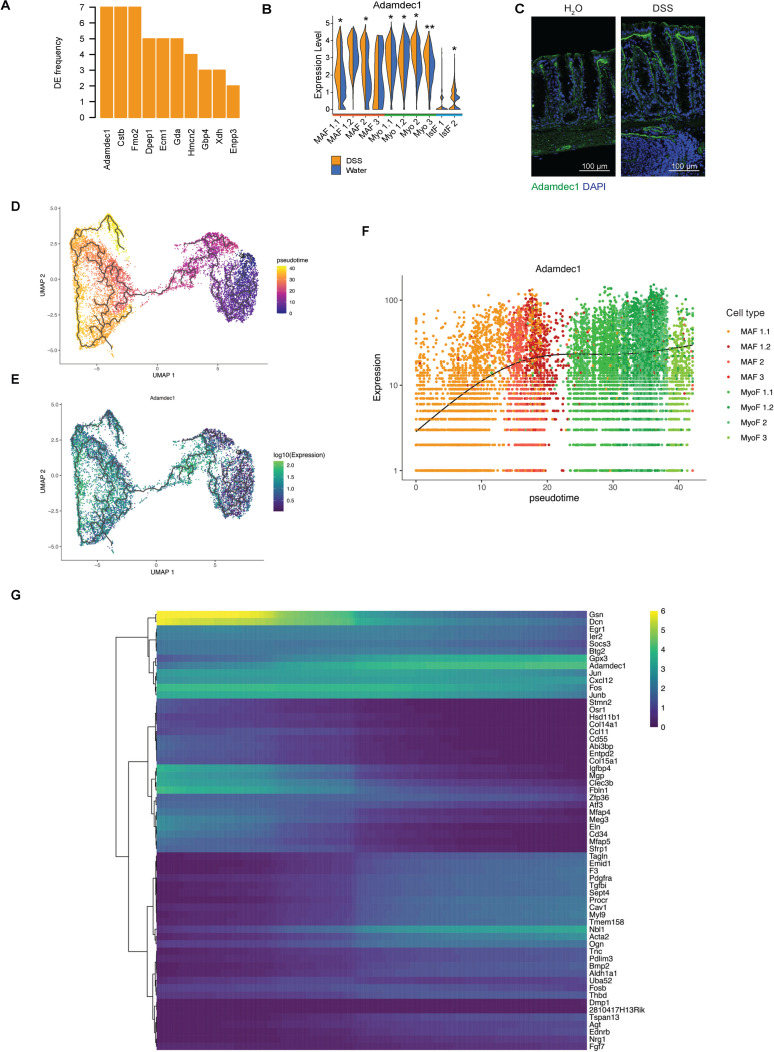
Fig 5. The myofibroblast differentiation program confers matrix remodeling function.
(A) Genes that are most often differentially expressed in all stromal clusters between water- and DSS-treated samples and whose expression is enriched in gastrointestinal tissues. The frequency of times they are a DEG is plotted on the y-axis. (B) Violin plot of Adamdec1 across fibroblast clusters in water- and DSS-treated samples. Normalized gene expression levels are plotted on the y-axis. Significant DEGs had FDR <0.05, and respective adjusted p-values derived using MAST (see Methods); *p < 0.05, **p < 0.001, ***p < 1E-10. (C) IF staining of colon from water- and chronic DSS-treated mice. Adamdec1 (green), DAPI (blue). Scale bar, 100 μm. n = 3. (D) Inferred differentiation trajectory for MAFs into myofibroblast subset populations. Each dot represents a cell, and color represents the estimated pseudotime for each cell. (E) Adamdec1 expression overlaid on top of inferred differentiation trajectory for MAF into myofibroblast subset populations. Each dot represents a cell, and color represents Adamdec1 expression. (F) Dynamics of Adamdec1 expression levels as a function of pseudotime. Each dot represents a cell, and color represents the annotated fibroblast subset. (G) Genes identified in association with MAF-to-myofibroblast inferred differentiation trajectory. Color indicates when gene expression peaks along differentiation trajectory along the x-axis (from left to right). DEG, differentially expressed gene; DSS, dextran sulfate sodium; FDR, false discovery rate; IF, immunofluorescence; MAF, mucosa-associated fibroblast; UMAP, uniform manifold approximation and projection.

