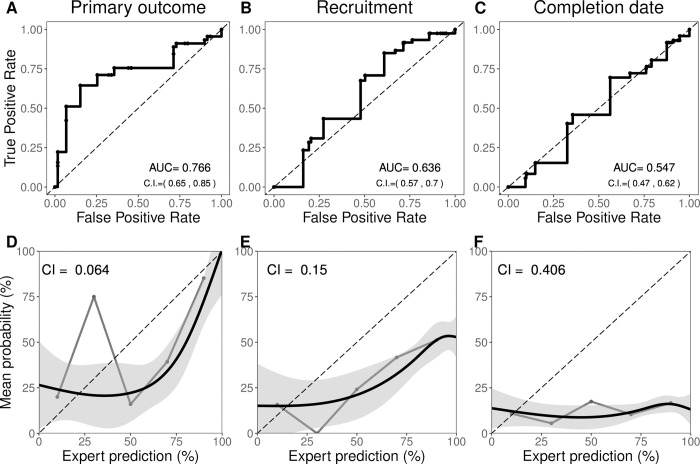
Fig 3. Discrimination and calibration.
A) Receiver Operator Characteristic. AUC = area under the curve with 95% bootstrap confidence intervals with 2000 resamples. B) Calibration Curves. Gray lines show 20%–wide bins, and black lines show model–based (GLM) calibration with confidence region; CI = calibration index.

