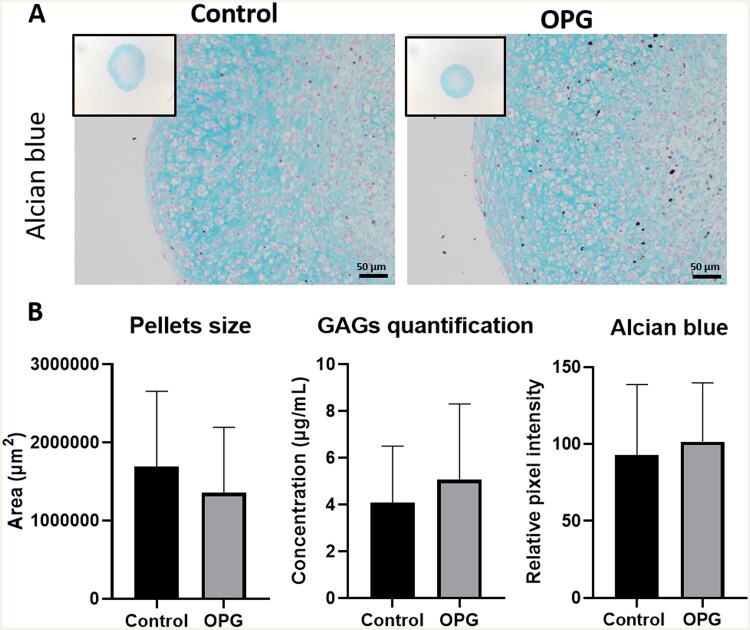
Fig. 1.
Alcian blue staining of neo-cartilage
(A) Representative images of 1-week neo-cartilage pellets as indicated (left: control chondrocytes; right: chondrocytes with TNFRSF11B overexpression). Scale bars: 50 μm. (B) Area of the pellets (n = 72), GAG-release in the medium (n = 27) and Alcian blue pixel intensity quantification (n = 18) for control and TNFRSF11B overexpressing chondrocytes.

